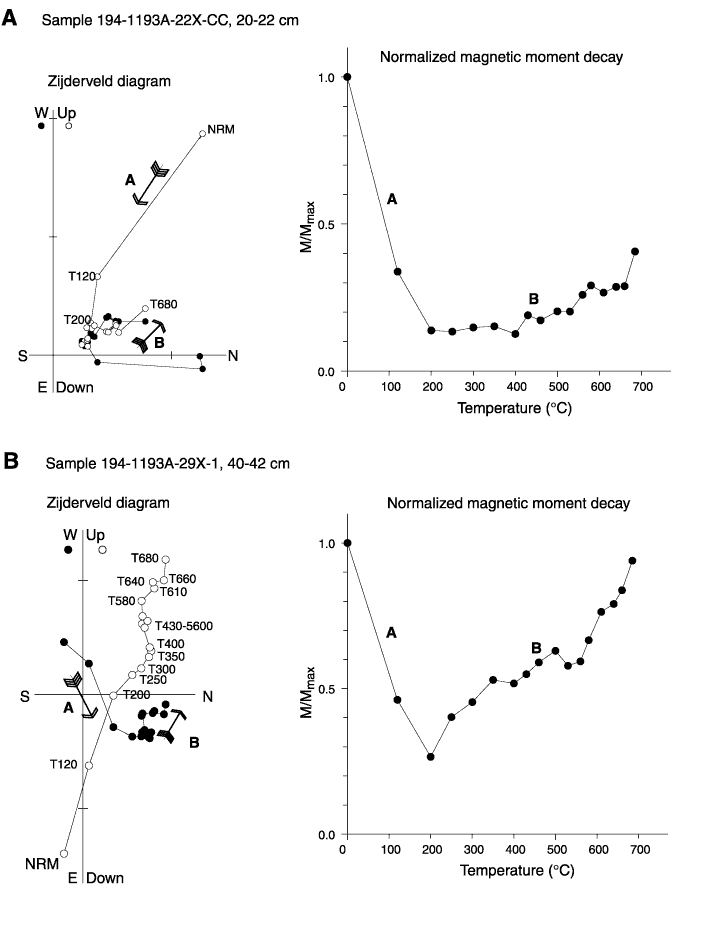
Figure F37.
Examples of Zijderveld diagrams of the thermally demagnetized samples and their
normalized magnetic moment decay curve equivalent. A. Sample
194-1193A-22X-CC, 20-22 cm. B. Sample 194-1193A-29X-1, 40-42
cm. NRM = natural remanent magnetization.


![]()