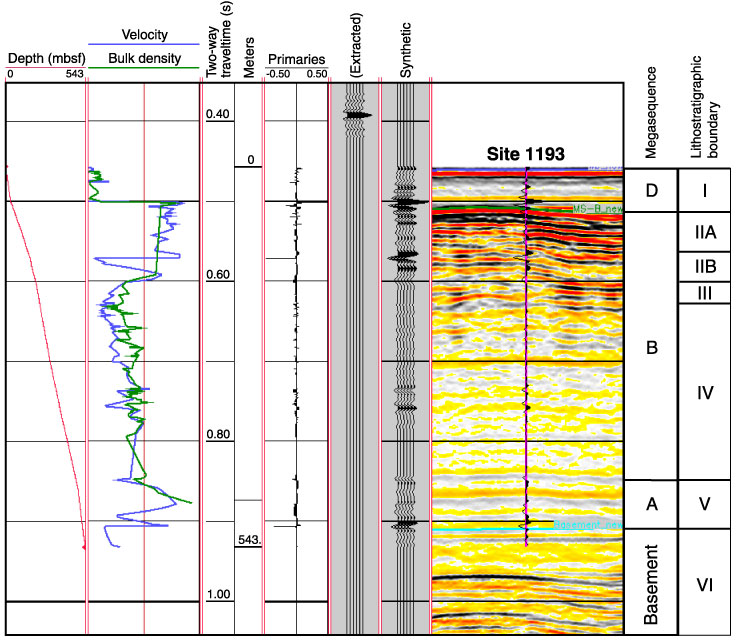
Figure F54.
Synthetic seismogram plotted on line MAR13 with two-way traveltime-to-depth
velocity data, P-wave velocity and gamma ray attenuation bulk
densities, extracted sonic wavelet, synthetic seismogram, the megasequence
boundaries, and lithologic boundaries. The traveltime-vs.-depth plot was used to
correlate seismic reflection events to their location with depth in the
sedimentary section.