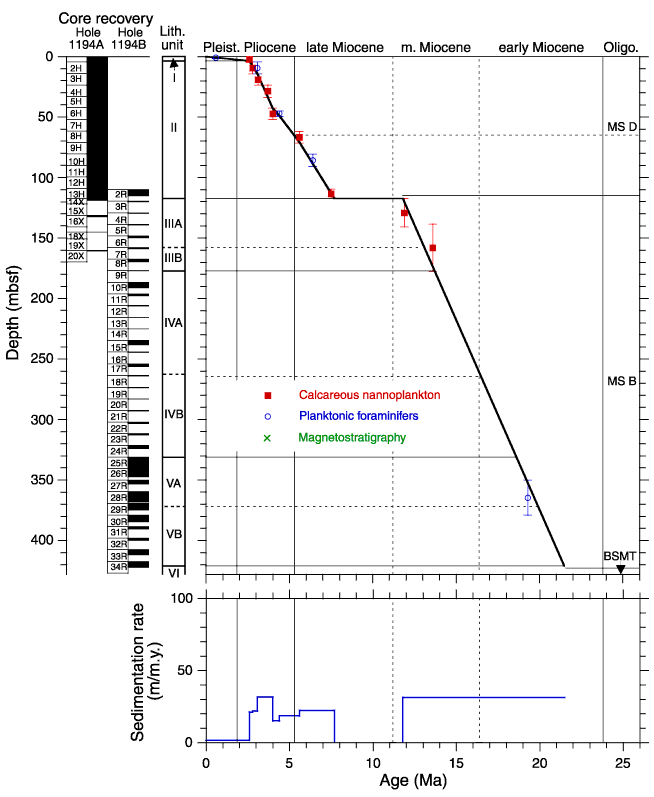
Figure F31.
Age-depth model and sedimentation rates at Site 1194. Horizontal lines spanning
from the left figure margin to the age-depth curve are lithologic unit (solid)
and subunit (dashed) boundaries. Horizontal lines spanning from the right margin
of the figure to the age-depth curve are seismic megasequence boundaries (solid)
and major reflectors within megasequences (dashed). Vertical lines are epoch
boundaries as labeled at the top of the diagram. BSMT = basement, MS =
Megasequence.


![]()