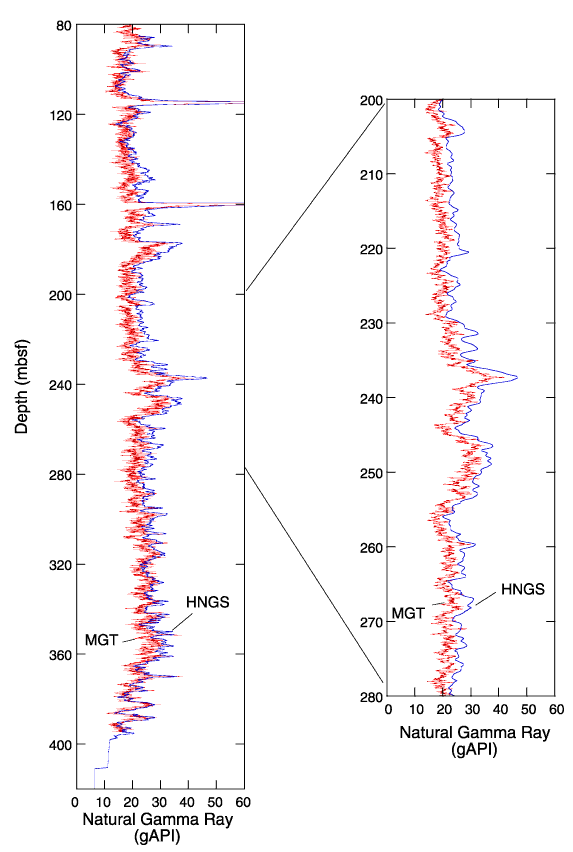
Figure F46.
Data produced by the HSGR tool (heavy red line) and the multisensor gamma ray
tool (MGT) (fine blue line) show a slight shift between the two curves but an
excellent correlation in the trend. Note the high resolution of the MGT. HNGS =
spectral gamma ray.


![]()