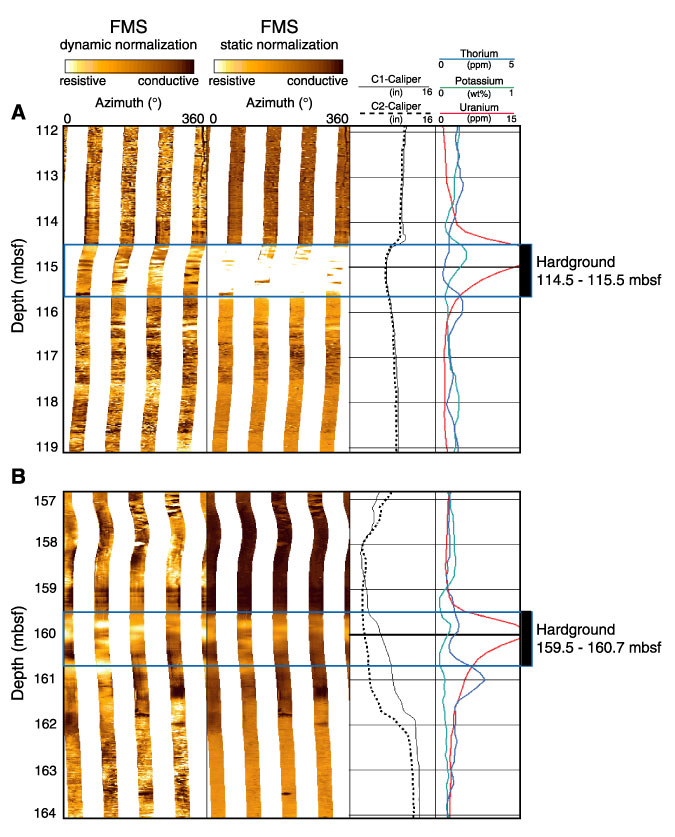
Figure F50.
Dynamic and static Formation MicroScanner (FMS) images and NGR logs across a
recovered and an inferred hardground in logging Unit 2. A. The
recovered hardground bed at 114.5 mbsf is capped by a phosphatic crust that is
probably responsible for the sharp peak in uranium. The thin densely cemented
bed is highly resistive with a sharp upper boundary. B. The
inferred hardground bed with a top at 159.5 mbsf also shows a peak in uranium
and an increase in resistivity.