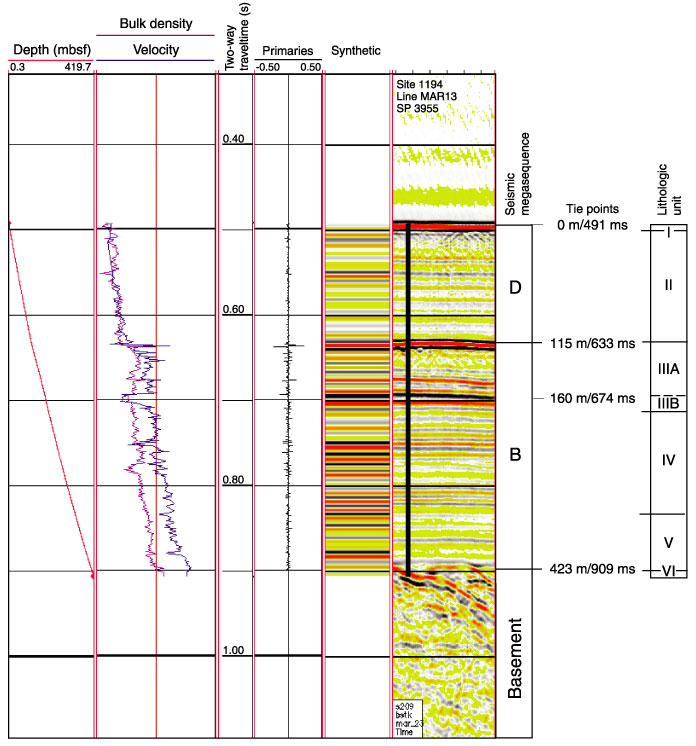
Figure F55.
Synthetic seismogram plotted on line MAR13 with two-way traveltime-to-depth
velocity data (m/s), P-wave velocity with superimposed GRA bulk
density, synthetic seismogram, megasequence boundaries, and lithologic units.
The traveltime-vs.-depth plot (left) was used to correlate seismic reflections
to their depth in the sedimentary section.