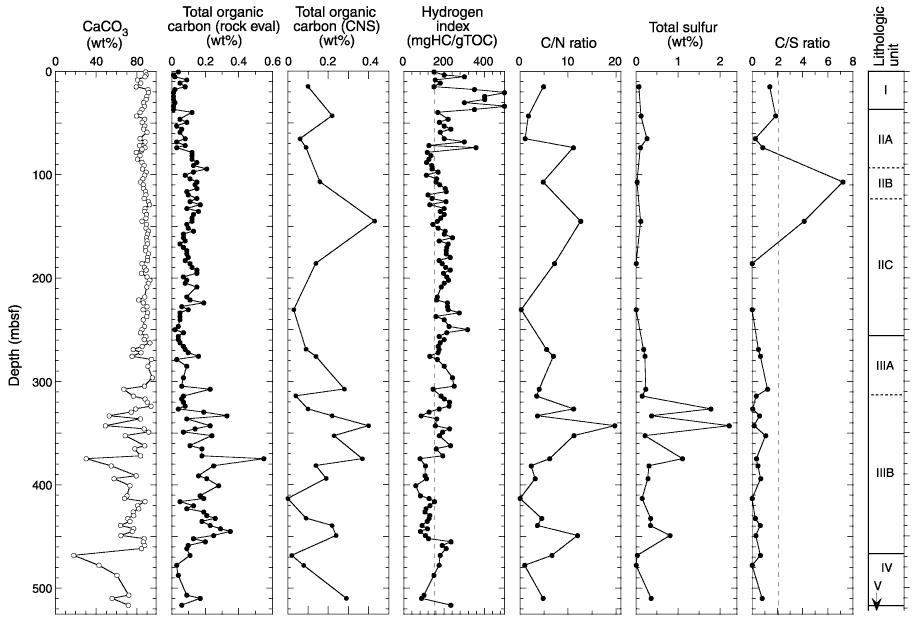
Figure F18.
Plots of carbonate and total organic carbon content, hydrogen index values,
total sulfur content, and C/N and C/S ratios, Site 1195. Solid vertical lines at
HI = 150 and C/S = 2 mark the approximate boundary between terrigenous (<150)
and marine organic matter and the transition between marine and brackish
environments of formation, respectively.