Figure F20. A.
Bulk density, grain density, and porosity as a function of depth at Site 1195.
Exponential least-squares regression of porosity using the combined Holes 1195A
and 1195B data set (line) is superimposed on the porosity values (solid
circles). B. Comparison of original and remeasured grain
density. Open circles = original beaker sample estimates, solid circles =
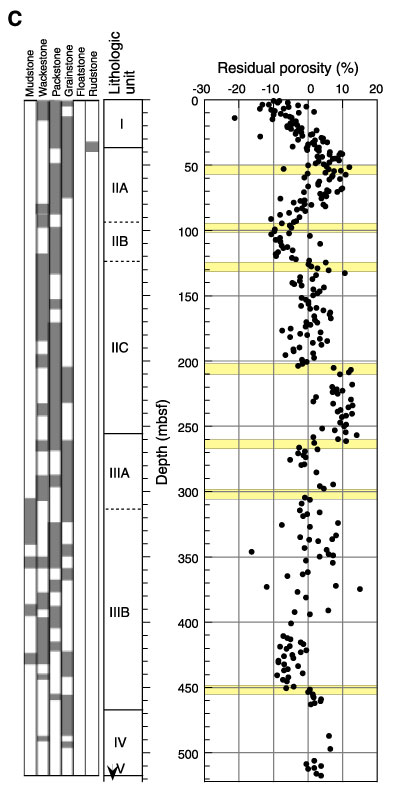
original cube sample estimates, triangles = remeasured beaker sample estimates. C.
Residual porosity, being the difference between the observed porosity and the
exponential least-squares regression shown in Figure F20A, compared
with carbonate grain size and lithologic units. Prominent offsets in the
residual porosity are highlighted.