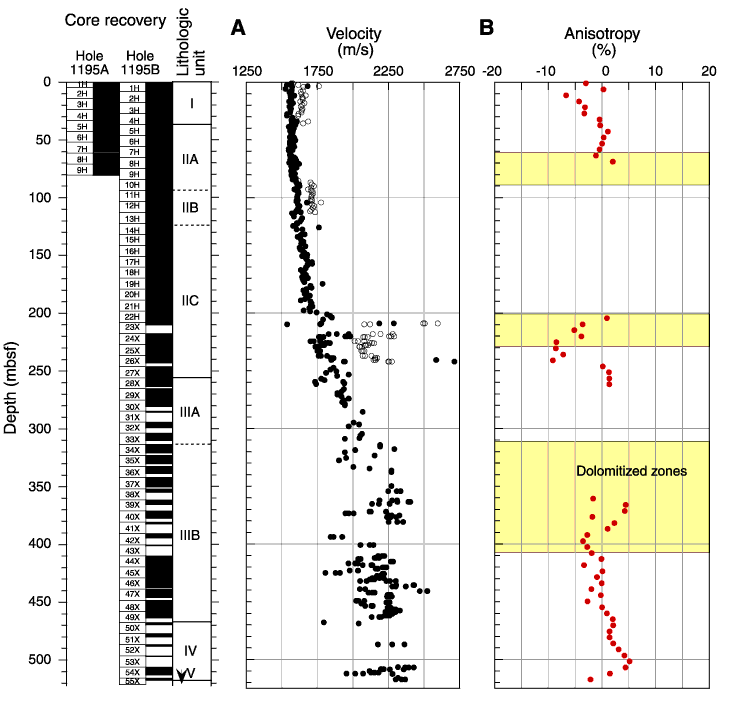
Figure F21. P-wave
velocity as a function of depth at Site 1195 using the PWS1 (z-direction) and
PWS2 (y-direction) insertion probe system and the PWS3 contact probe system. A.
Original (solid and open circles) and adjusted (solid circles) velocities.
Circles represent data affected by measurement errors. For data offsets below
120 mbsf, a correction of 100 m/s was applied. For data between 200 and 250 mbsf,
velocity values were reduced by 310 m/s. B. Seismic anisotropy
between the average transverse and longitudinal velocities as a function of
depth. Location of dolomitized zones are shown by the yellow intervals.


![]()