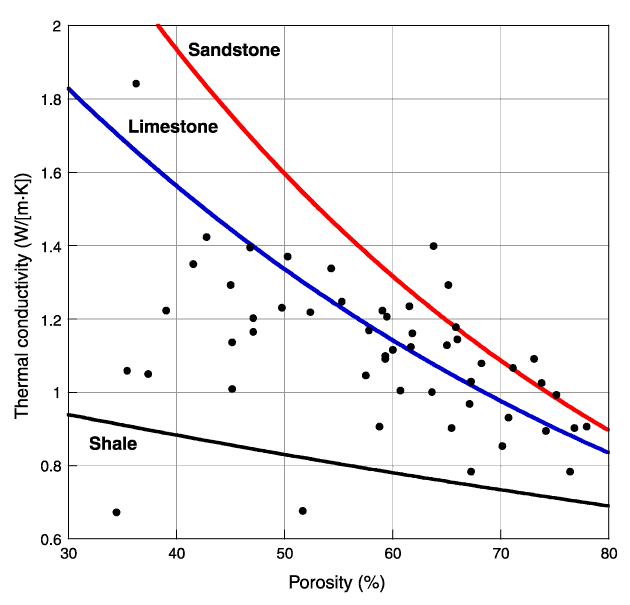
Figure F24.
Crossplot of Site 1195 porosity and thermal conductivity. Superimposed are the
power law curves, constructed from the observed range in porosity, for ideal
end-member sedimentary facies: sandstones (red/upper curve), limestones
(blue/center curve) and shales (black/lower curve). The observed thermal
conductivity values lay between the shale and sandstone curves, and given the
large carbonate content of the sedimentary section, suggests that much of the
sediment at Site 1195 represents a mixing of clay and sandstone with carbonates.


![]()