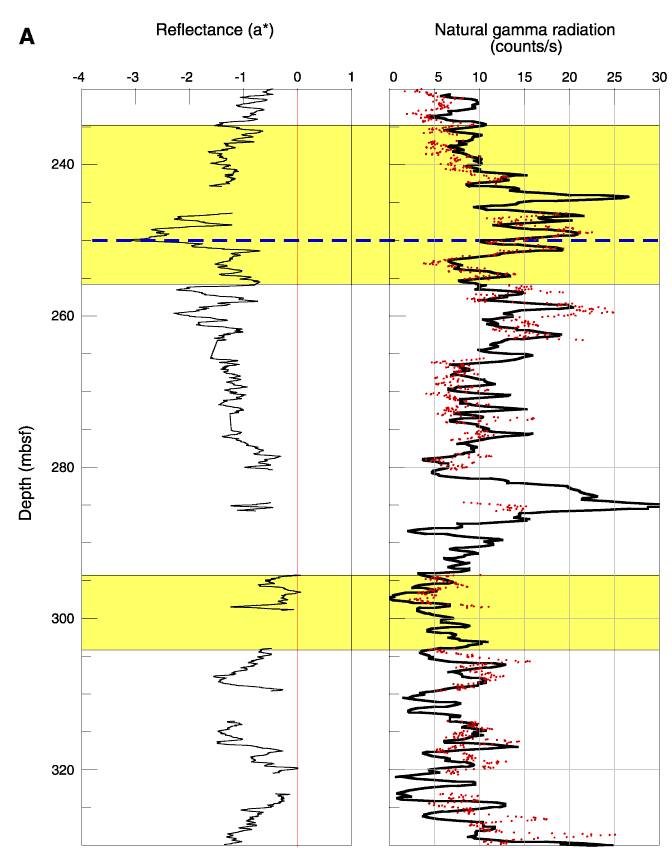
Figure F27. A.
Comparison between the color reflectance parameter a* (left graph), the MST-NGR
(red dots), and the logging HNGS (black line) gamma radiation data and
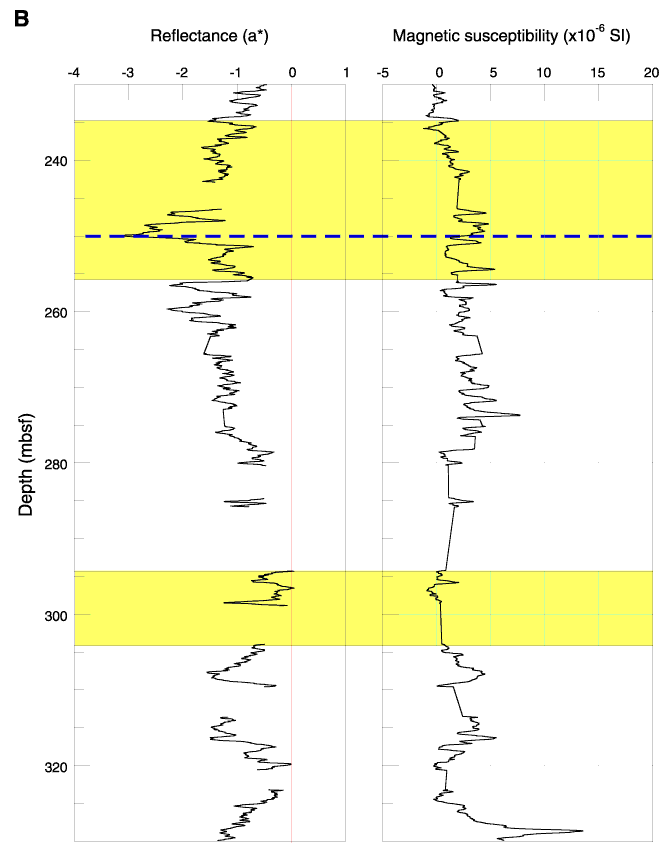
glauconite-rich sediment units (yellow intervals) for Site 1195B. B.
Comparison between color reflectance parameter a* (left graph), magnetic
susceptibility (red line), and glauconite-rich units (yellow intervals) for Site
1195B. The glauconite-rich intervals do not show any correlation with the
magnetic susceptibility.


![]()