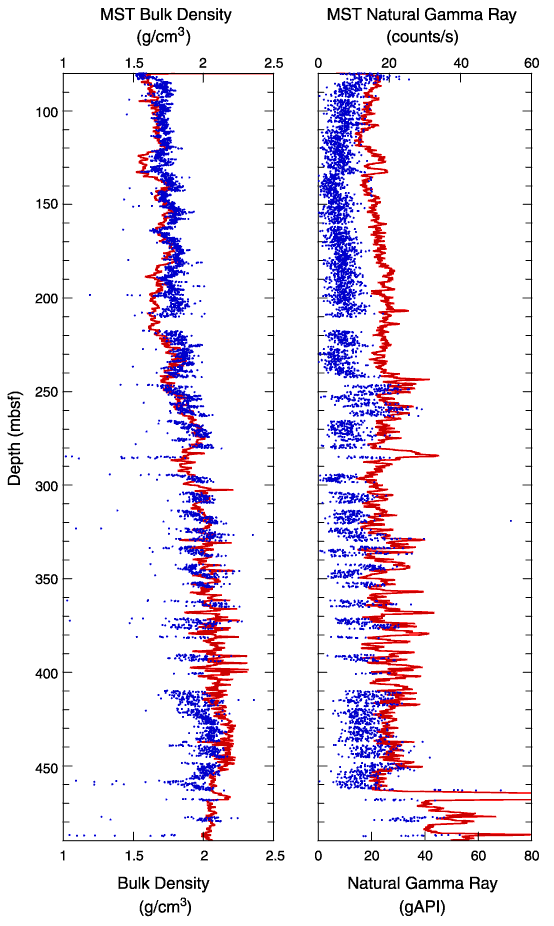
Figure F29.
Comparison of core measurements and corresponding downhole logs at Site 1195.
There is an overall good correlation of the curve shapes, with slight
differences in absolute values in density. Note the different units for the core
and log natural gamma ray data.