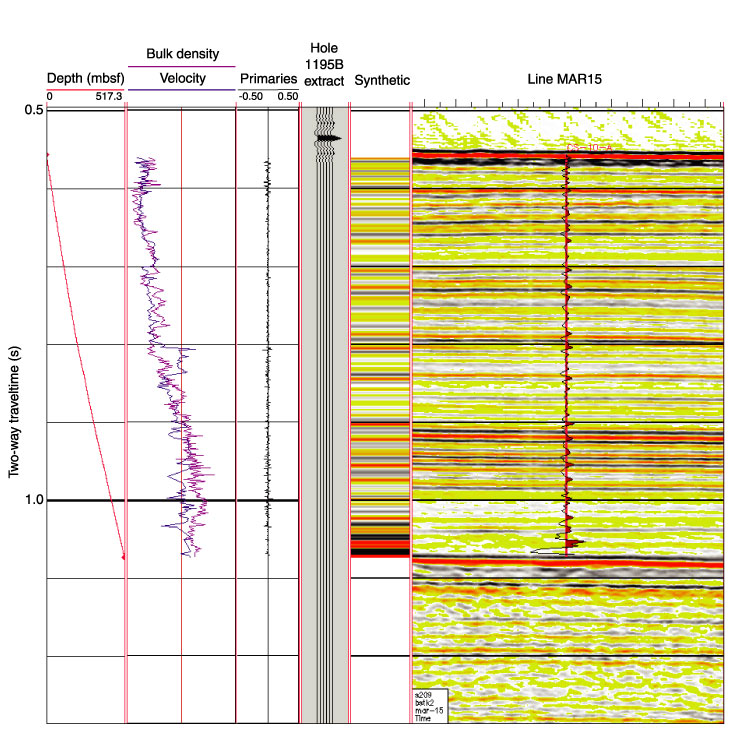
Figure F32.
Synthetic seismogram plotted on line MAR15 with two-way traveltime-to-depth
velocity data (m/s), P-wave velocity and GRA bulk density, extracted
sonic wavelet, synthetic seismogram, the megasequence boundaries, and lithologic
boundaries. The traveltime vs. depth plot was used to correlate seismic
reflection events and their location with depth in the sedimentary section.