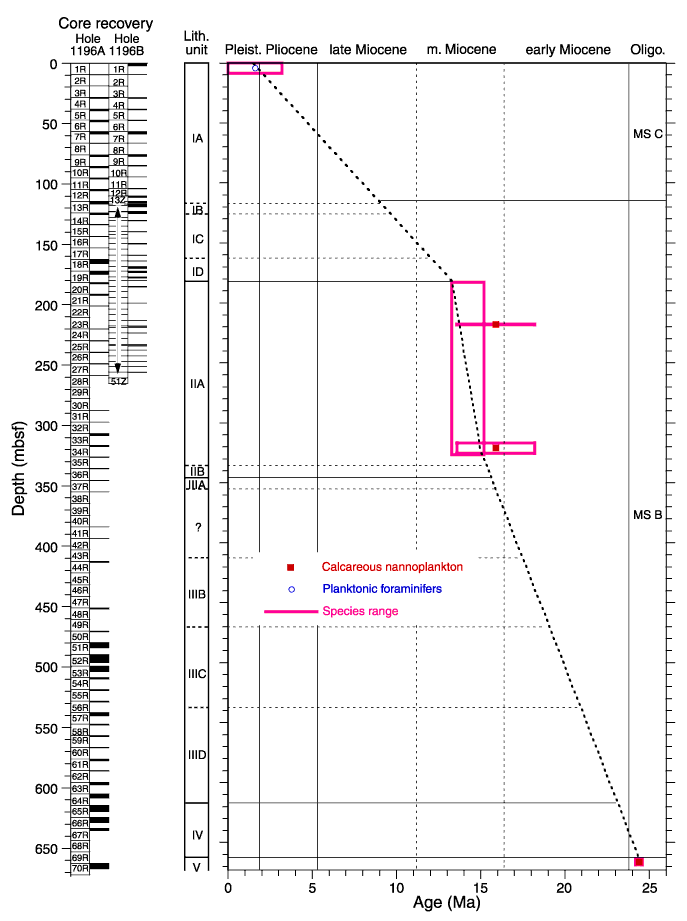
Figure F42. Age-depth model and sedimentation rates at Sites 1196 and 1199. Horizontal lines spanning from the left figure margin to the age-depth curve are lithologic unit (solid) and subunit (dashed) boundaries. The horizontal line spanning from the right margin of the figure to the age-depth curve is a seismic reflection that might correspond to the seismic Megasequence B/C boundary. Vertical lines are epoch boundaries as labeled at the top of the diagram. MS = Megasequence.

![]()