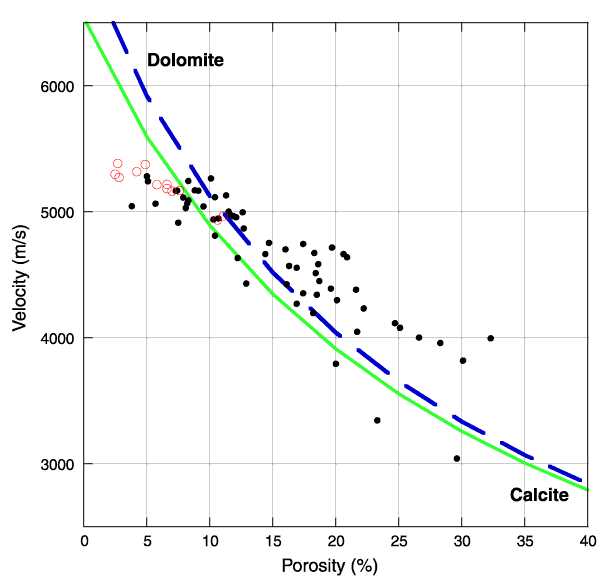
Figure F57. Crossplot of velocity vs. porosity for Site 1199. Solid and dashed lines = the time-average equations for calcite and dolomite (Wyllie et al., 1956). Circles = velocity-porosity pairs from the bottom of lithologic Subunit IA and its boundary with lithologic Subunit IB (90-110 mbsf).

![]()