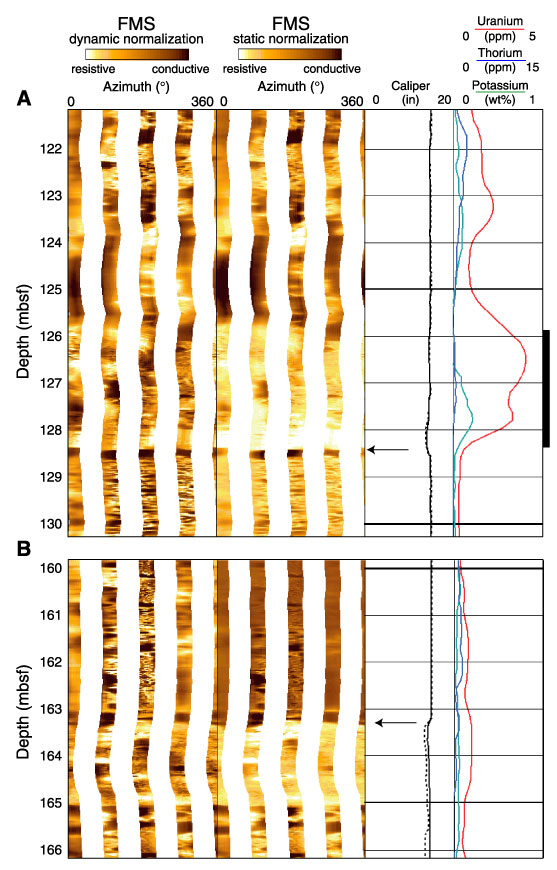
Figure F64. A. Formation MicroScanner (FMS) image of the interval at 121-130.2 mbsf. The arrow points to the log signature change at 128.4 mbsf that corresponds to the lithologic boundary between Subunits IB and IC. The strata above shows increased uranium concentration (red line). B. FMS image of the interval at 160-166.2 mbsf. Arrow points to a slightly irregular surface above a high resistivity bed at the top of logging Unit 3 that potentially corresponds to the top of the middle Miocene platform growth phase.
![]()