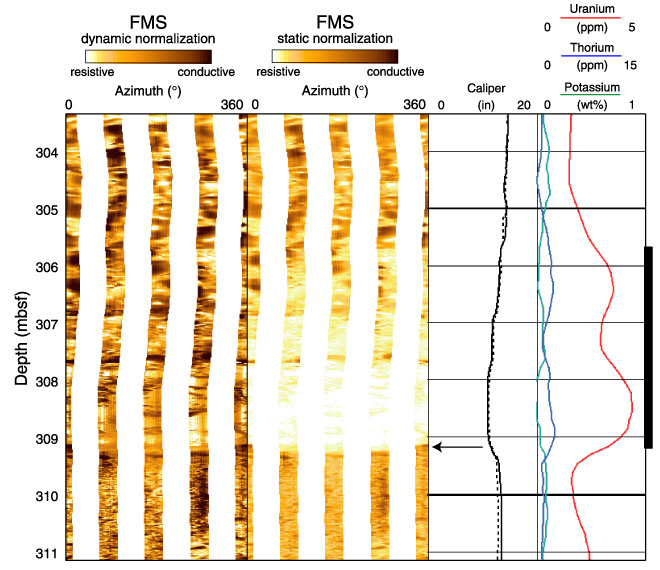
Figure F65. Formation MicroScanner (FMS) image of the interval at 303.5-311 mbsf. Two beds of high resistivity and high uranium content mark the beginning of a log change in the lower part of logging Unit 3 above a slightly irregular surface at 309.1 mbsf (arrow).
![]()