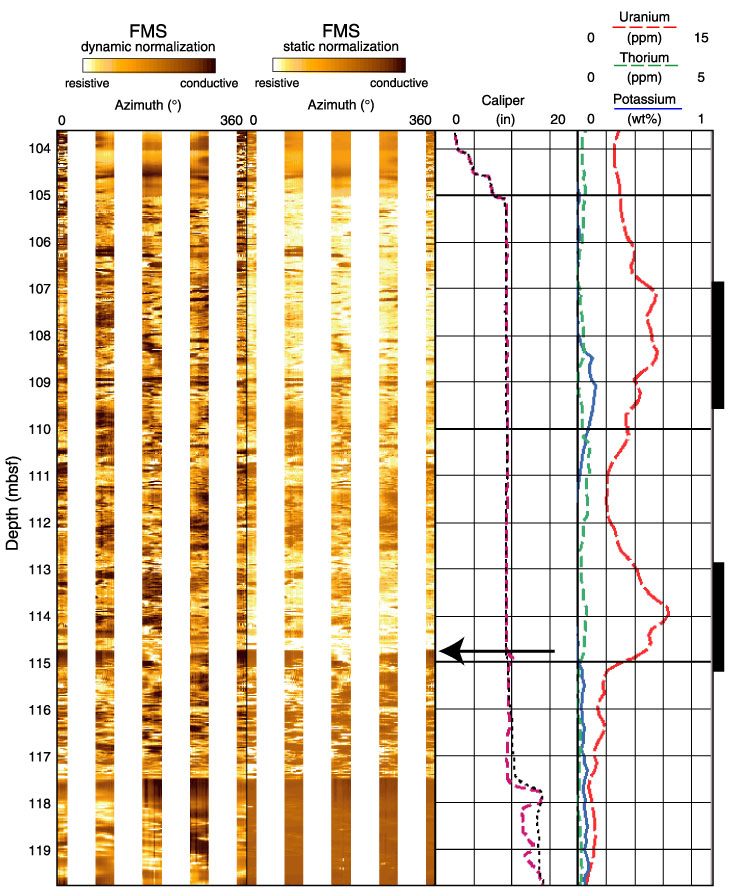
Figure F69. Formation MicroScanner (FMS) image of 103.5-120 mbsf. A high-resistivity bed (arrow) characterizes the lower boundary of logging Unit 1 or lithologic Subunit IB, respectively. This bed and a higher resistive section between 106.5 and 109.5 mbsf show high uranium concentrations (black rectangles).
![]()