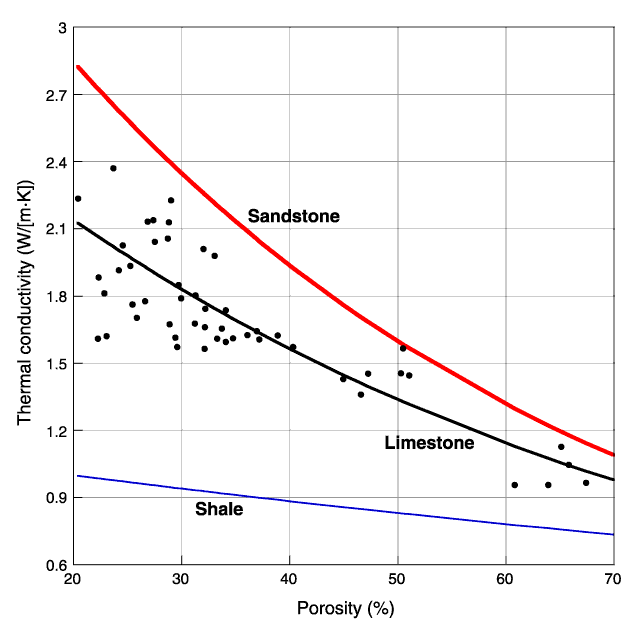
Figure F32. Crossplot of Site 1197 porosity and thermal conductivity. Superimposed are the power law curves, constructed from the observed range in porosity, for ideal end-member sedimentary facies: sandstone (red/upper curve), limestone (blue/center curve), and shale (black/lower curve).

![]()