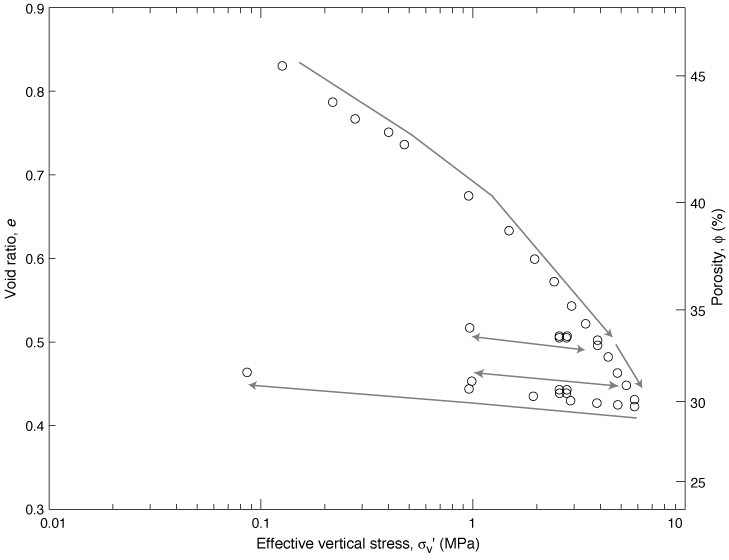
Figure F9. Deformation behavior for Sample 194-1198A-21H-3, 140-142 cm. Void ratio is plotted on a linear scale on the left y-axis and equivalent porosity is plotted on the right y-axis. Gray arrows illustrate loading/unloading/reloading paths. Raw data are provided in Table T13.


![]()