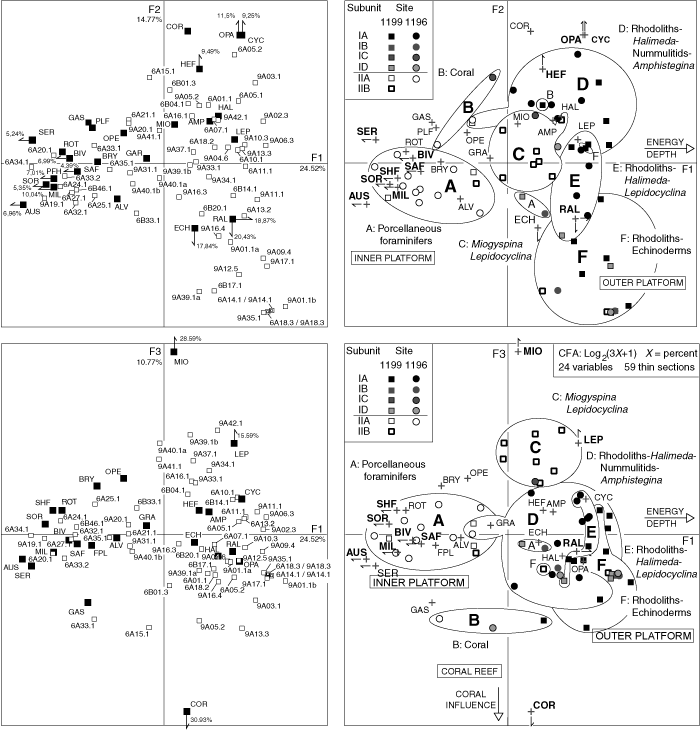
Figure F7. Correspondence factor analysis (CFA) planes of axes 1-2 and 1-3 with microfacies and environmental interpretation. The variance of each axis is given in percentage. Circled groups of samples = main microfacies (A–F) defined by the cluster analysis. See Table T2, for variable definitions. Variables in bold with arrow and absolute contribution in percentage = significant variables according to specified factorial axes.


![]()