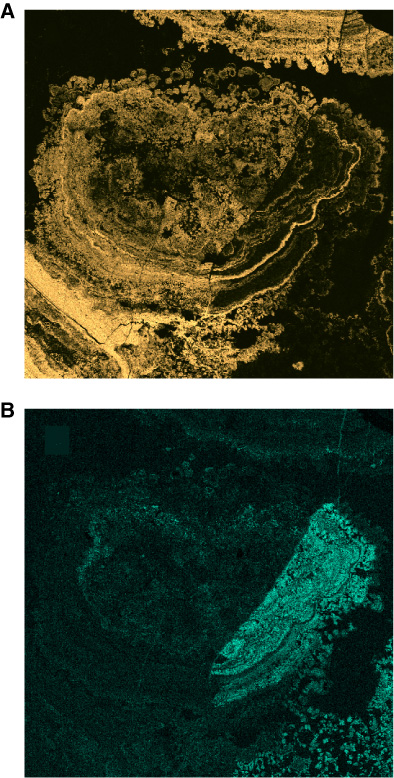
Figure F10.
Electron microprobe elemental maps for (
A
) Fe and (
B
) Mn in Core 194-1196B-1R. Brightness corresponds to Fe and Mn content, respectively. Images are 0.56 cm across.