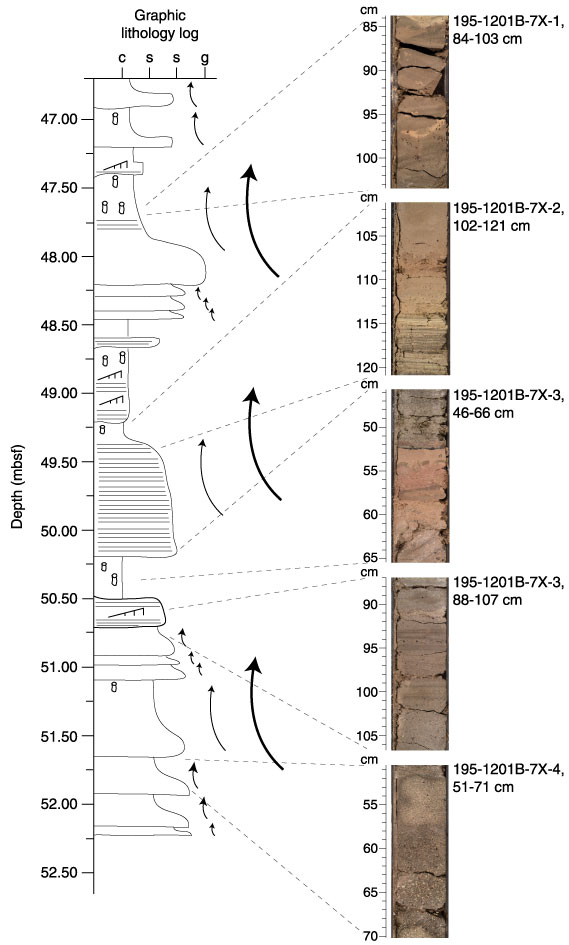
Figure F10.
Representative graphic lithology log and core photos of sandstone and
bioturbated silty claystone turbidites in Core 195-1201B-7X. Structures are
drawn to scale. Arrows indicate the different scales of fining-upward sequences.
In the graphic lithology log, c = clay, s = silt, s = sand, g = gravel.