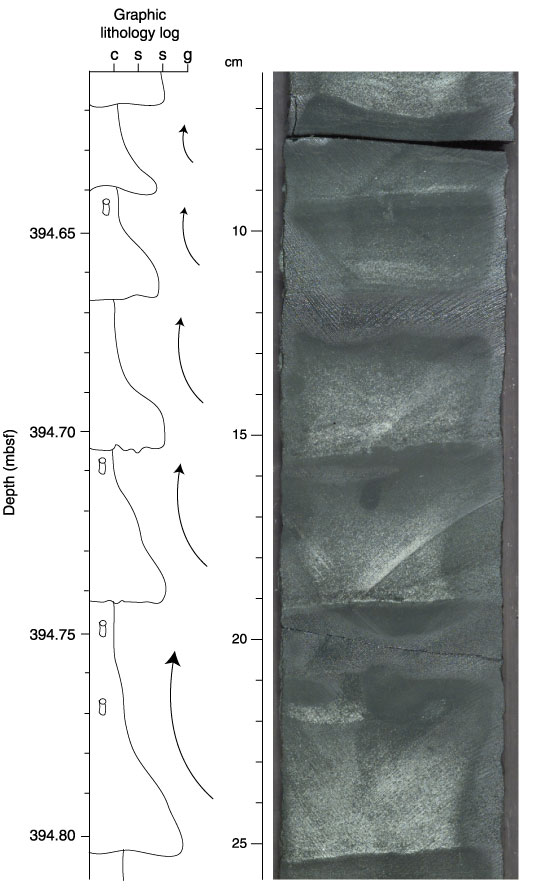
Figure F12.
Representative graphic lithology log and core photo of sandstone and bioturbated
silty claystone turbidites in interval 195-1201D-33R-5, 6-26 cm, with multiple
fining-upward sequences drawn to scale. In the graphic lithology log, c = clay,
s = silt, s = sand, g = gravel.