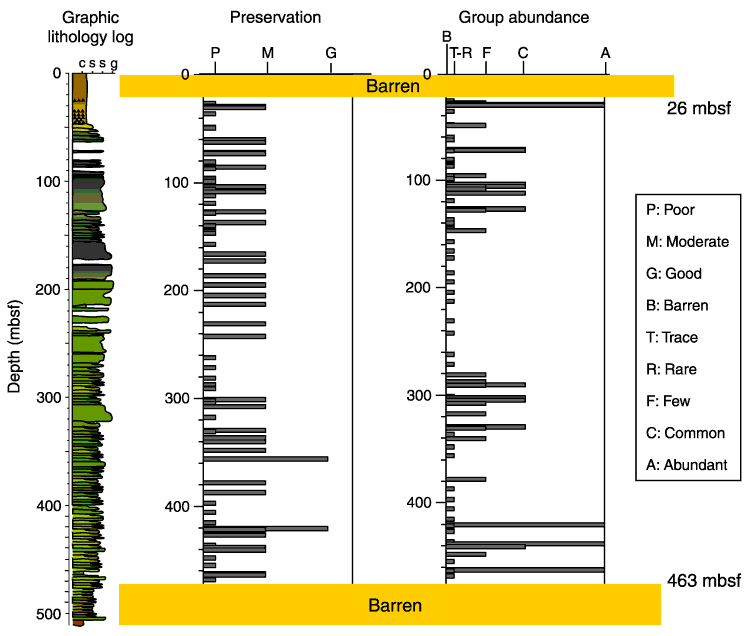
Figure F48.
Preservation and abundance of calcareous nannofossils for Holes 1201B and 1201D
plotted with the graphic lithology log. The scale representing the preservation
state and nannofossil abundance is arbitrary, designed to enhance visualization
of the patterns. In the graphic lithology column, c = clay, s = silt, s = sand,
g = gravel.


![]()