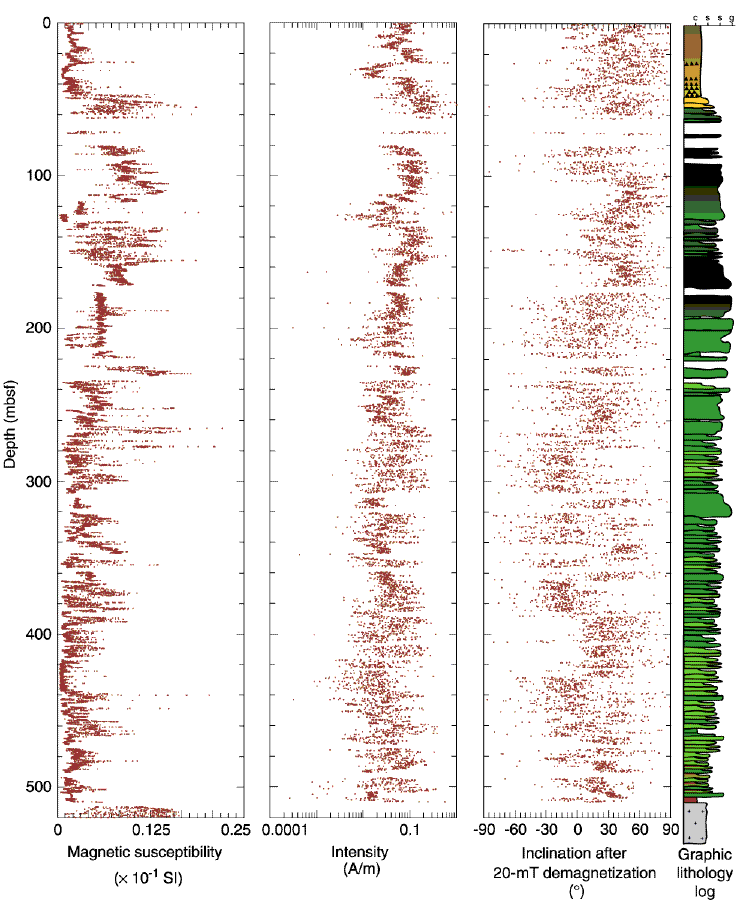
Figure F55.
Magnetic susceptibility, intensity, and inclination of the composite record at Site 1201. Magnetic intensity is plotted before AF demagnetization. In the graphic lithology log, c = clay, s = silt, s = sand, g = gravel.