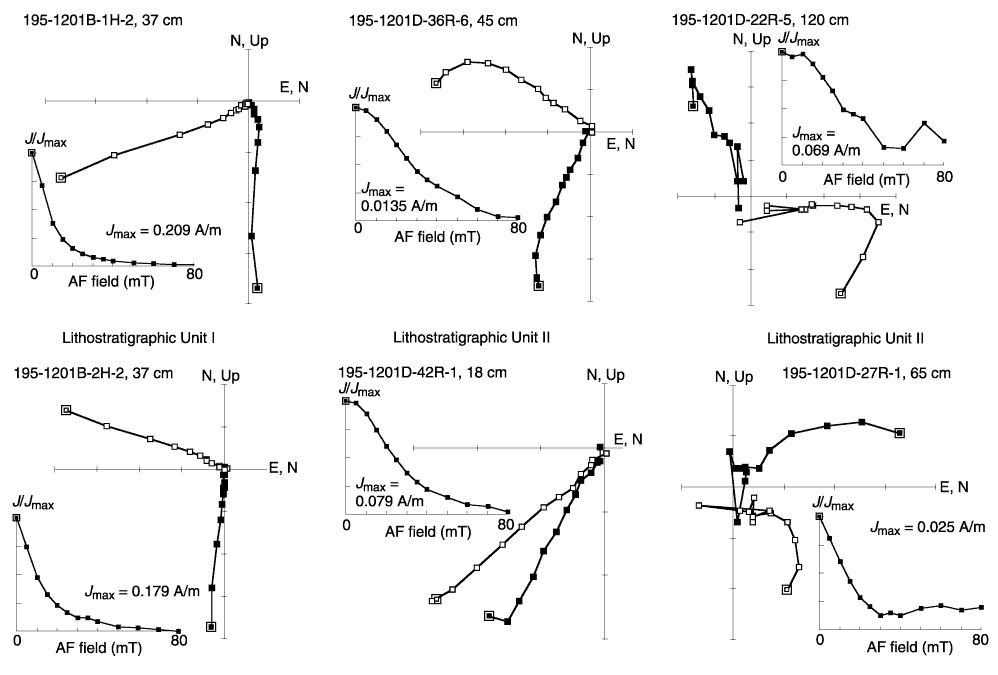
Figure F56.
Vector component diagram with normalized intensity decay plots of
demagnetization (AF) behavior for representative sediment samples from Site
1201. Open (solid) symbols represent projections onto the vertical (horizontal)
plane. The core is not azimuthally oriented; therefore the declination values
are not meaningful.


![]()