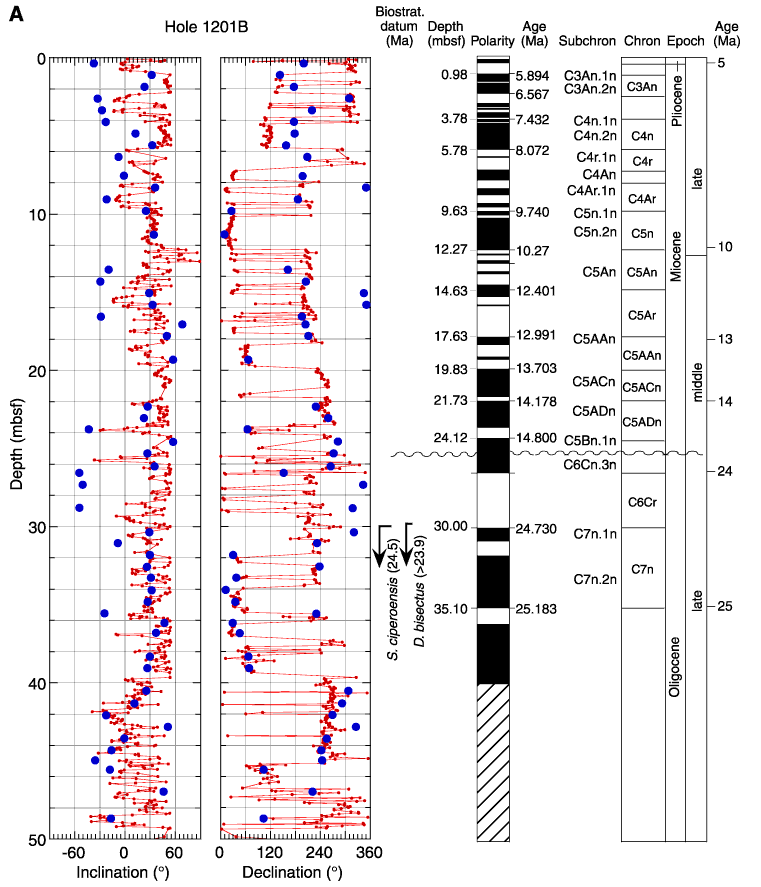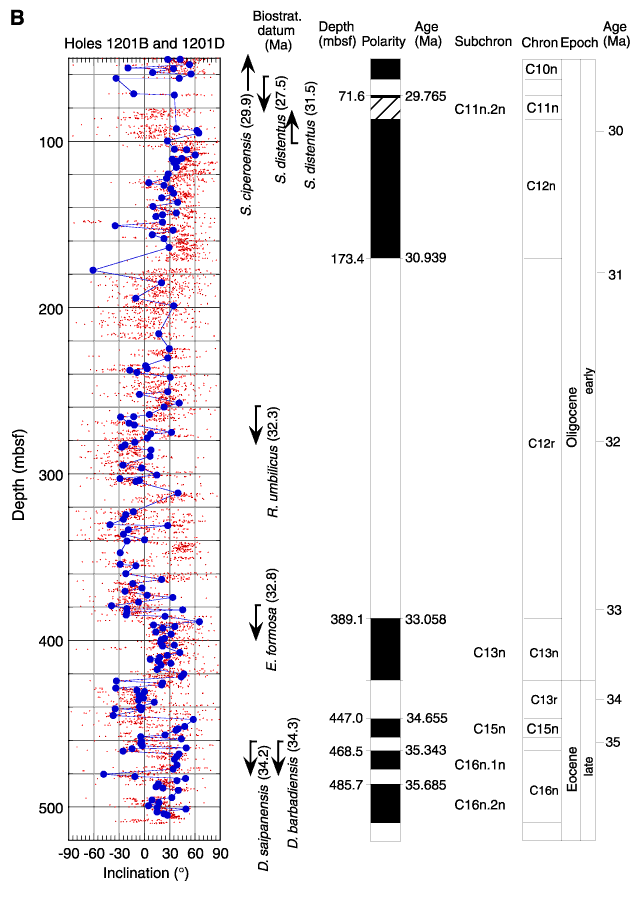
Figure F57.
Magnetostratigraphic record from Site 1201 A. (0-50 mbsf) The
plot of NRM inclination and declination is after demagnetization at 20 mT.
Inclinations and declinations of discrete samples (solid circles) were
determined by linear regression fits to multiple demagnetization steps. Polarity
is shown on the log to the right: black = normal polarity, white = reversed
polarity, hatched intervals = undetermined polarity, undulating line = hiatus.
Chron ages for polarity reversal boundaries are from Berggren et al. (1995). PCA
= principal component analysis. B. (50-509 mbsf).


![]()