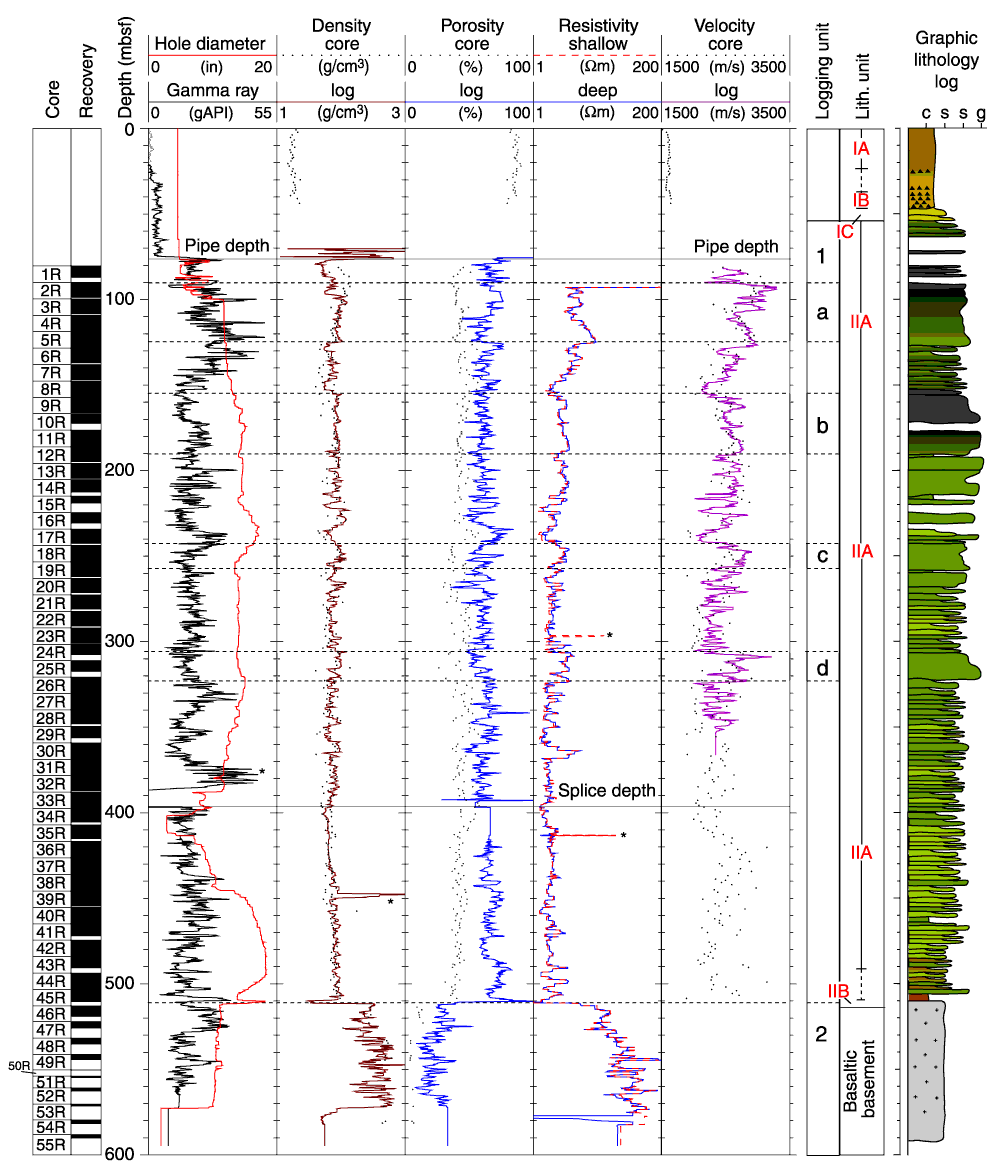
Figure F83.
Summary of downhole logging results in Hole 1201D; caliper, total gamma ray
emission, density, porosity, resistivity, and sonic velocity logs are shown. The
depths of the pipe and the splice between the two uplogs are marked. * =
spurious data or spikes (see "Data Quality" in "Downhole
Measurements" and Table T14
for further information). The logging units are marked, and coarser
turbiditic beds a-d are highlighted. Laboratory physical properties measurements
of the density, porosity, and sonic velocity of core material are also plotted
along with the graphic lithology log based on core descriptions. In the graphic
lithology log, c = clay, s = silt, s = sand, g = gravel.


![]()