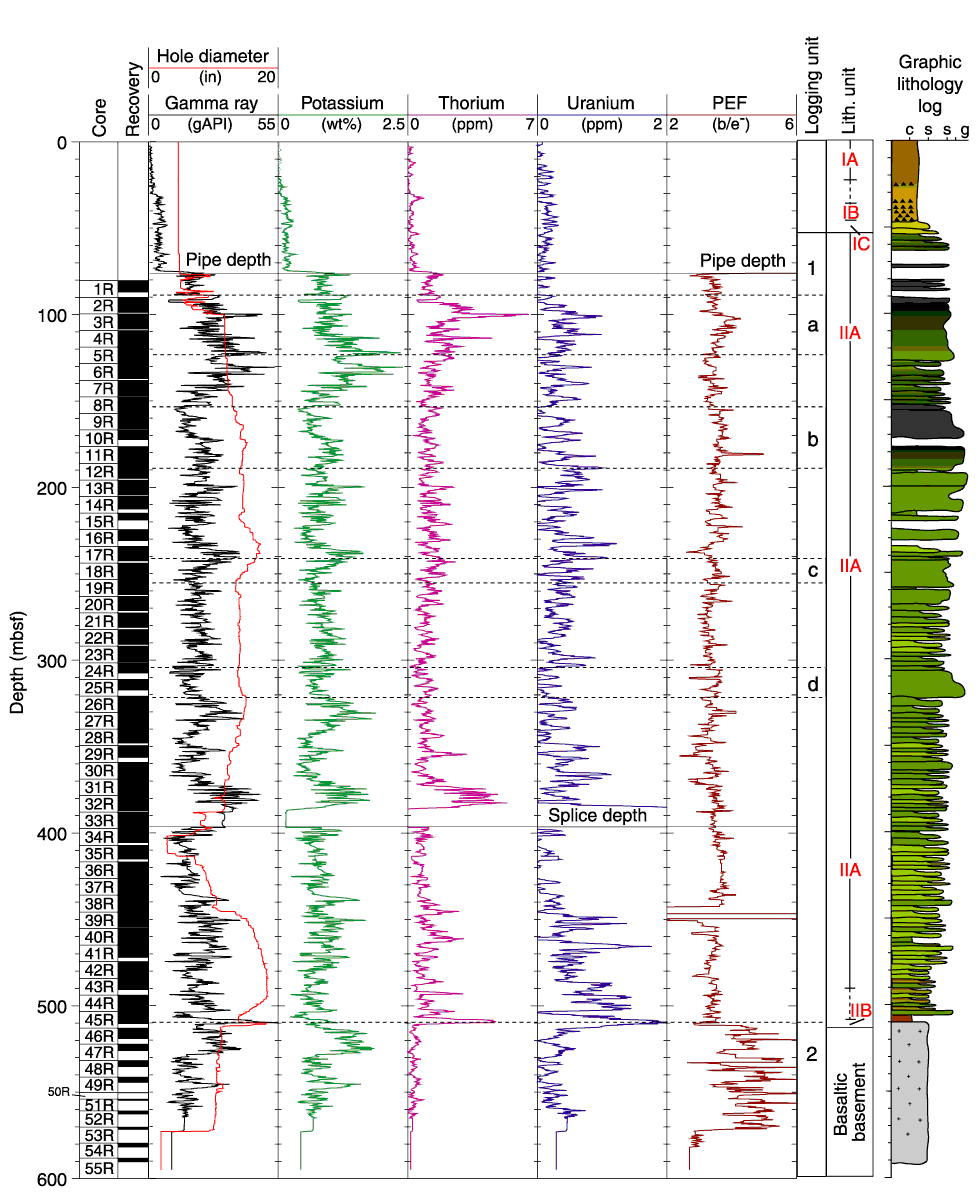
Figure F84.
Summary of natural gamma ray logs in Hole 1201D; total gamma ray emission,
potassium, thorium, uranium, and photoelectric effect (PEF) curves are displayed
along with the graphic lithology log. The depths of the pipe and the splice
between the two uplogs are marked. Logging units are marked, and coarser
turbiditic beds a-d are highlighted. In the graphic lithology log, c = clay, s =
silt, s = sand, g = gravel.


![]()