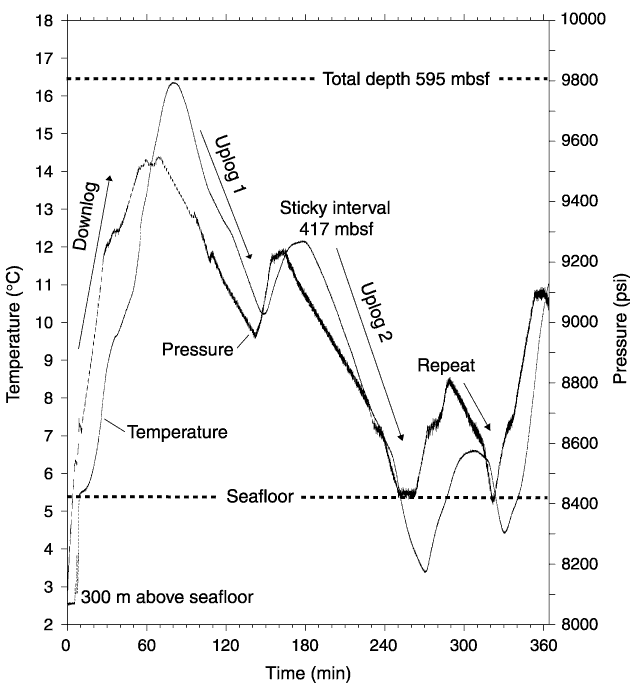
Figure F86.
Pressure and temperature data obtained from the TAP tool in Hole 1201D plotted
against elapsed time. The temperature and pressure variations reflect the
different stages of lowering and raising of the tool within the hole (see
"Temperature Log" in "Downhole
Measurements" for explanation).


![]()