![]() Figures F1-F21
Figures F1-F21
![]() Tables
T1-T3
Tables
T1-T3
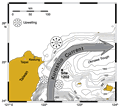
F1. Approximate path of the Kuroshio Current.
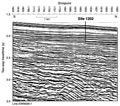
F2. North-south trending MCS reflection profile near Site 1202.
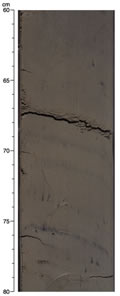
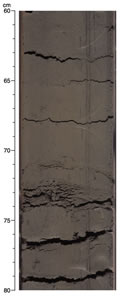
F3. Black centimeter-scale horizons, Unit I.
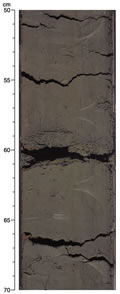
F4. Normally graded interval, Unit I.
F5. Calcareous, sand-sized interval in silty clay, Unit I.
F6. Magnetic intensity behavior over time.
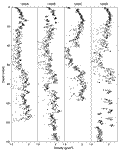
F7. Downcore magnetic inclination and intensity.
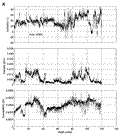
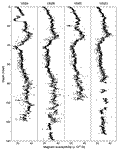
F8. Magnetic susceptibility.
![]()
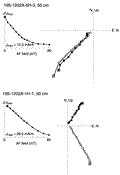
F9. Vector component diagram with intensity decay plots.
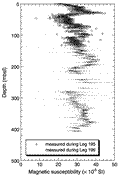
F10. Volume magnetic susceptibility.
F11. MST volume magnetic susceptibility, Hole 1202D.
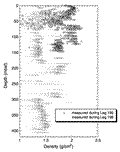
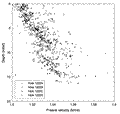
F12. Bulk density results.
F13. GRA bulk density results.
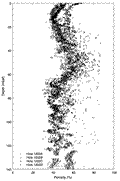
F14. Porosity derived from GRA density.
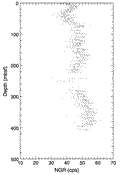
F15. Natural gamma radiation, Hole 1202D.
F16. P-wave velocity.
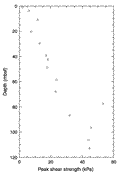
F17. Peak shear strength.
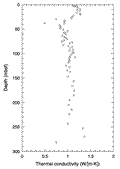
F18. Thermal conductivity.
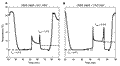
F19. Temperature measurements.
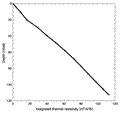
F20. Integrated thermal resistivity vs. depth.
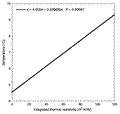
F21. Temperature vs. integrated thermal resistivity.
T1. Coring summary, Site 1202.
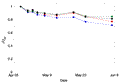
T2. Distribution of calcareous nannofossils.
T3. Physical properties.