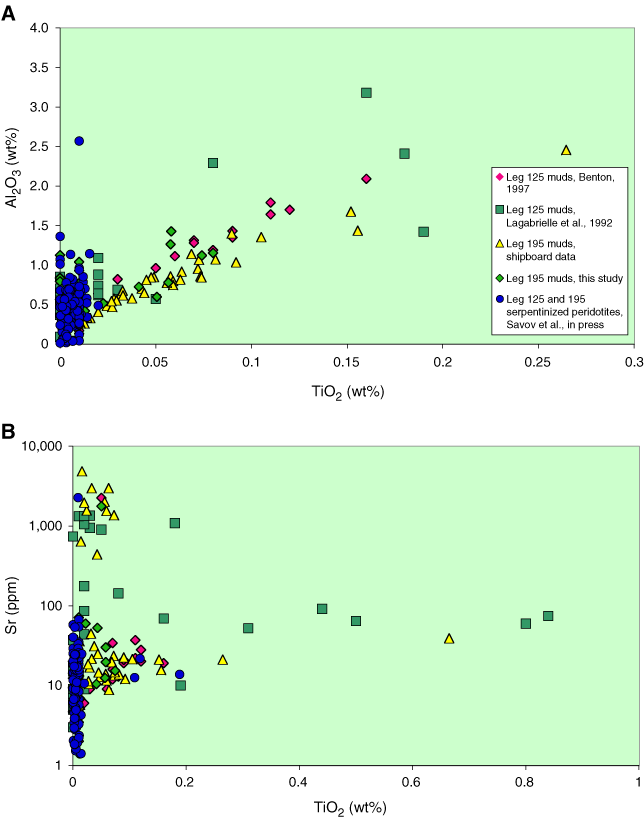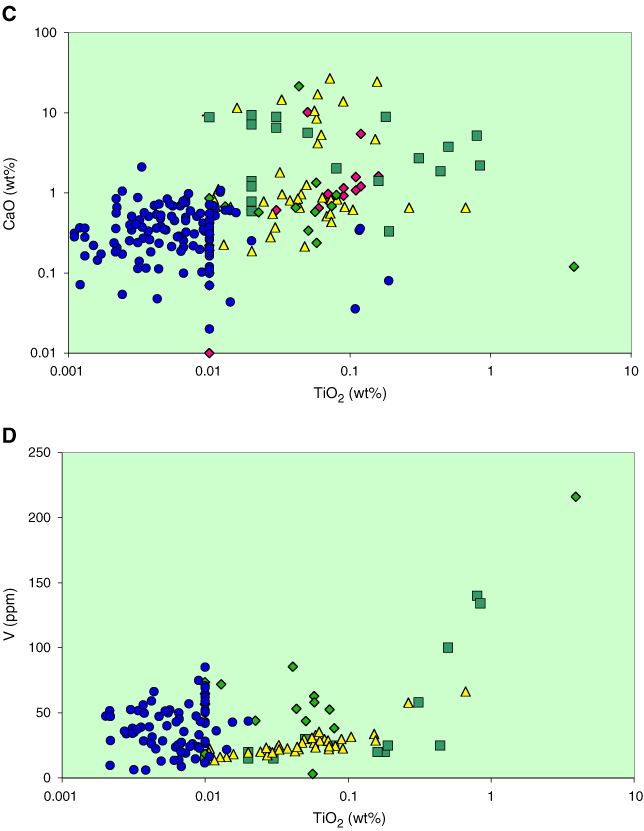
Figure F7. A. TiO2 vs. Al2O3 for serpentinite muds. Note the positive correlation, especially for the Leg 195 Shipboard and Leg 125 (Benton, 1997) data sets. B. TiO2 vs. Sr for serpentinite muds. Serpentinite mud samples with very high Sr contents (>500 ppm) were recovered from near the seafloor and correspond to the high CaO samples of Figure F5C. There is a trend of increasing TiO2, whereas Sr contents remain unchanged. The Sr abundances measured in the deep serpentinite muds are similar to those of the serpentinized peridotites. C. TiO2 vs. CaO for serpentinite muds. There is no correlation between the TiO2 and CaO contents. Abundances of TiO2 ~0.01 wt% seem to discriminate well between the serpentine muds and serpentinized peridotites. Symbols are the same as in A. D. TiO2 vs. V for serpentinite muds. The Leg 195 serpentinite muds from Guggino et al. (2002) show highest vanadium and the ODP Leg 195 shipboard muds show the lowest vanadium. However, the V range in the serpentinized peridotites (6–85 ppm) overlaps the one measured in the serpentinite muds. Symbols are the same as in A.


![]()