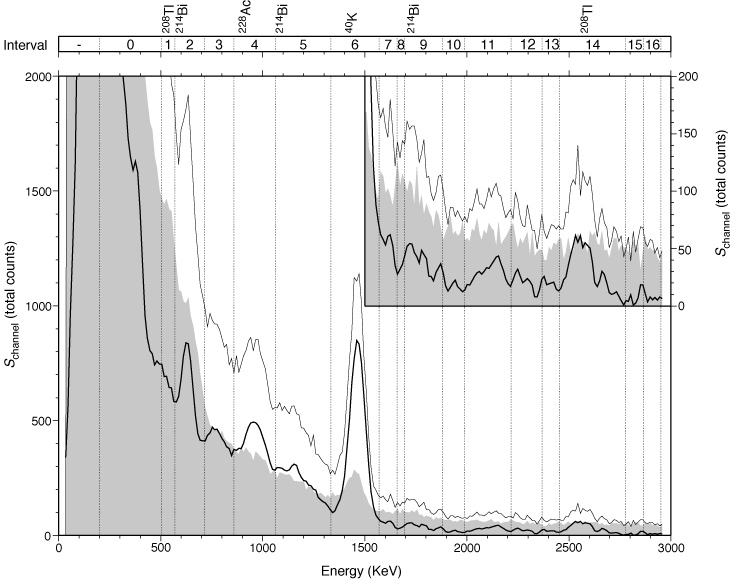
Figure F3. The NGR spectra for the measurement at 509.36 mbsf (heavy black line) after removing the background spectrum (gray region) and applying a three-point mean boxcar filter. The thin black line shows the raw spectrum. Dotted lines mark the interval boundaries defined by Blum et al. (1997). Prominent energy peaks relating to certain elements are identified at the top of the figure. The inset shows the spectrum for energies >1500 KeV at a 5x expanded scale.