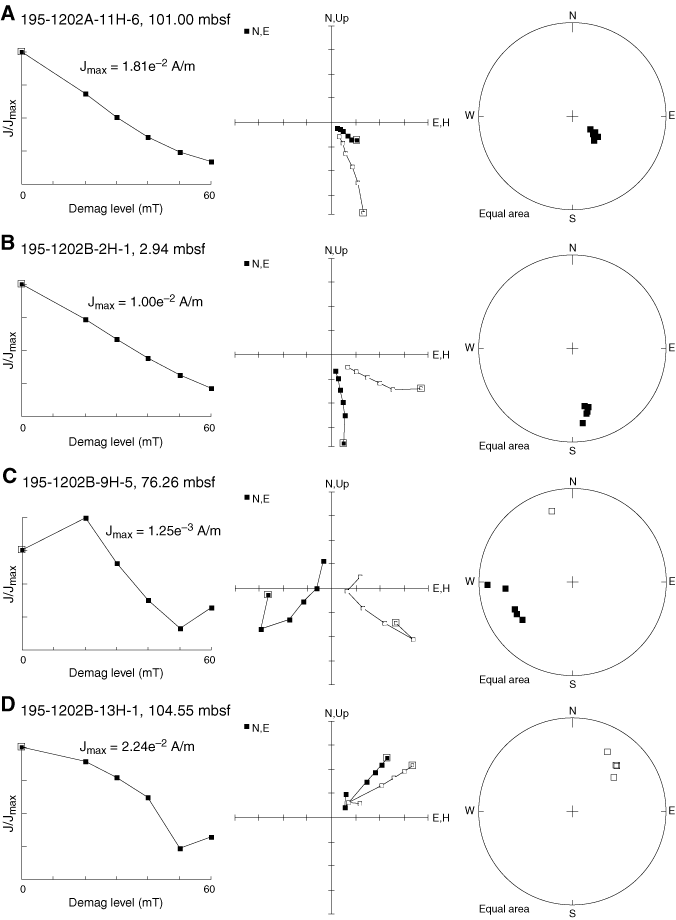
Figure F2. Vector component diagrams with normalized intensity decay plots and stereographic projections of alternating-field (AF) demagnetization behavior for four representative samples from Holes 1202A and 1202B. Open (closed) symbols represent projections on the vertical (horizontal) plane. A. Section 195-1202A-11H-6. B. Section 195-1202B-2H-1. C. Section 195-1202B-9H-5 D. Section 195-1202B-13H-1.


![]()