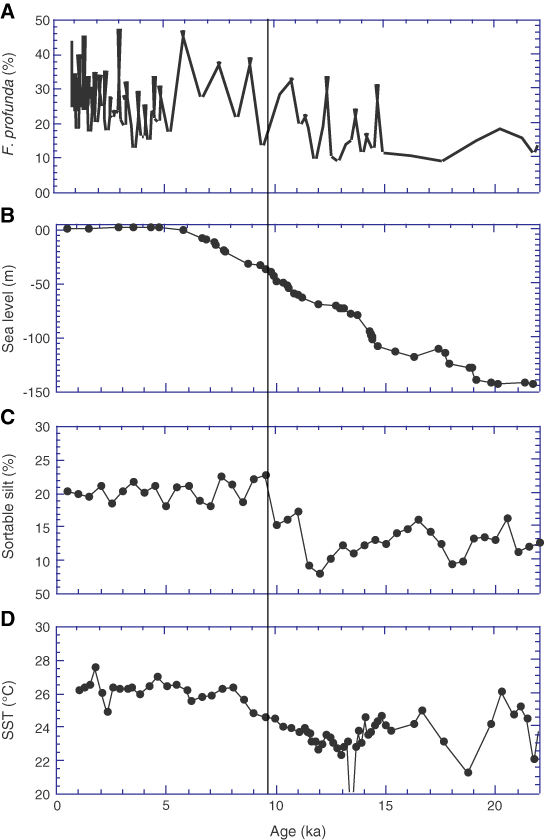
Figure F9. Comparison between calcareous nannofossil abundance, sea-surface temperature, sediment granulometry, and sea level during the past 13 k.y. A. Percentage of deep-dwelling nannofossil Florisphaera profunda (data from X. Su, pers. comm., 2005). B. Sea level variation compiled from Lambeck et al. (2002) and Chen and Liu (1996). C. Percentage of sortable silt (10–63 Ám) in the silt fraction (Diekmann et al., submitted [N1]). D. Sea-surface temperature derived from Uk┤37 (Zhao et al., 2005).


![]()