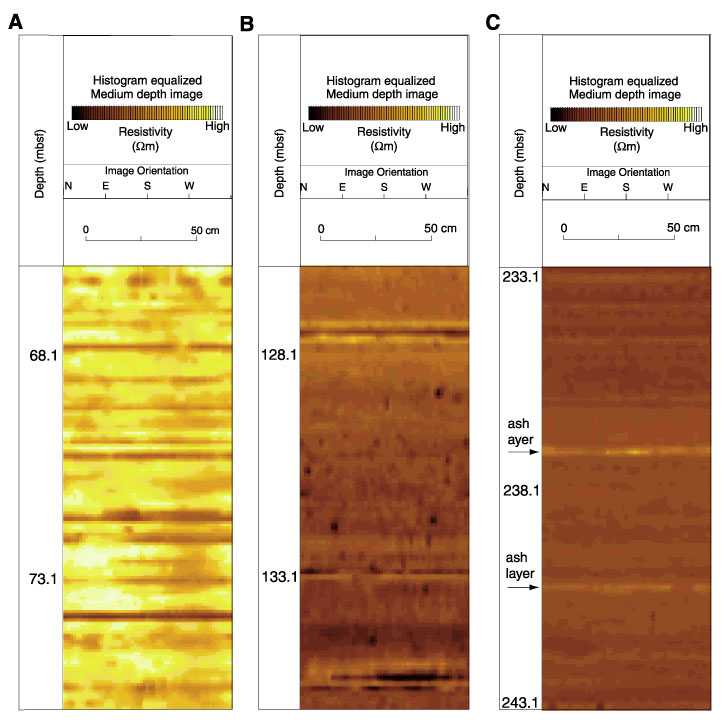
Figure F13.
Examples of resistivity-at-the-bit images of different units, Site 1173. Images
were processed using an equalized histogram over the entire hole. A.
Image of well-stratified thinly bedded turbidites within lithologic Unit I
(trench-wedge facies). Resistive (light) bands represent finer grained sediments
(clays, silts), whereas conductive (dark) bands represent coarser grained
sediments (sands, silts) at the base of turbidite beds. B.
Image of hemipelagic muds of lithologic Unit II (upper Shikoku Basin facies)
with conductive reduction spots indicative of bioturbation. C.
Image of resistive volcanic ash layers within lithologic Unit II (upper Shikoku
Basin facies). Vertical scale = 1:60, horizontal scale = 1:12.4.