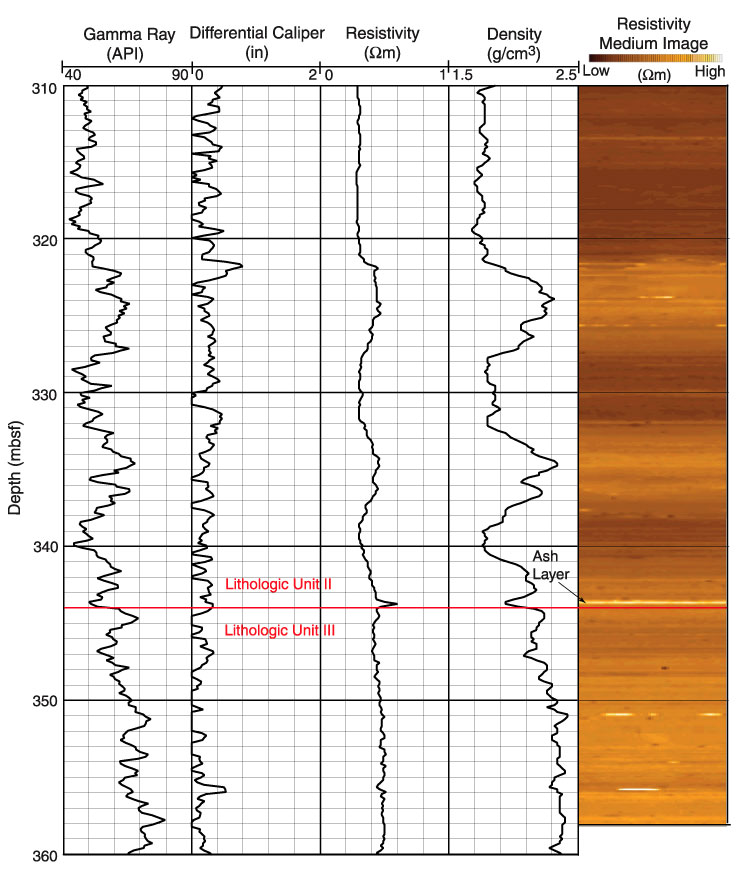
Figure F15.
Composite figure of gamma ray, differential caliper, resistivity, and density
logs and a resistivity-at-the-bit (RAB) image of the log Unit 2-3 transition
(310-360 mbsf). The RAB image was added to show the thickness of sediment
packages. The boundary between lithologic Units II and III is marked.