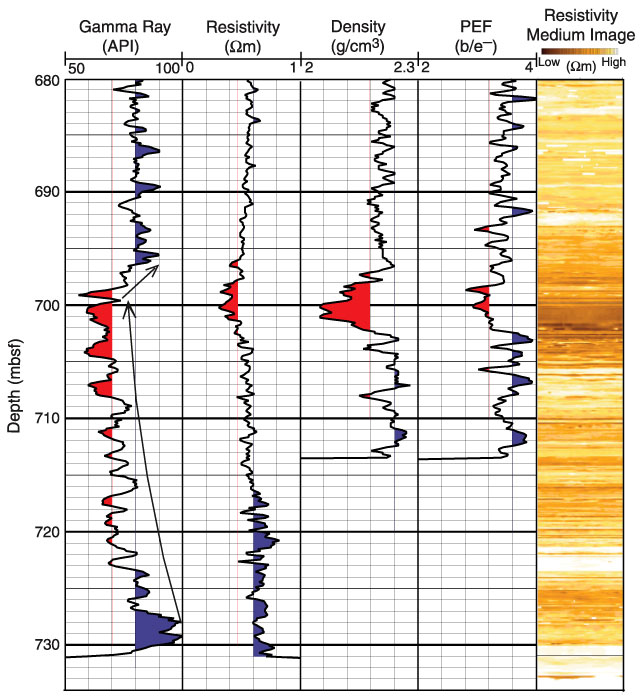
Figure F16.
Composite figure of gamma ray, resistivity, density, photoelectric effect (PEF)
logs and a resistivity-at-the-bit image of the volcaniclastic facies section
(680-735 mbsf). The arrows show an upward coarsening trend of sediments between
700 and 728 mbsf and a fining-upward trend between 696 and 700 mbsf.