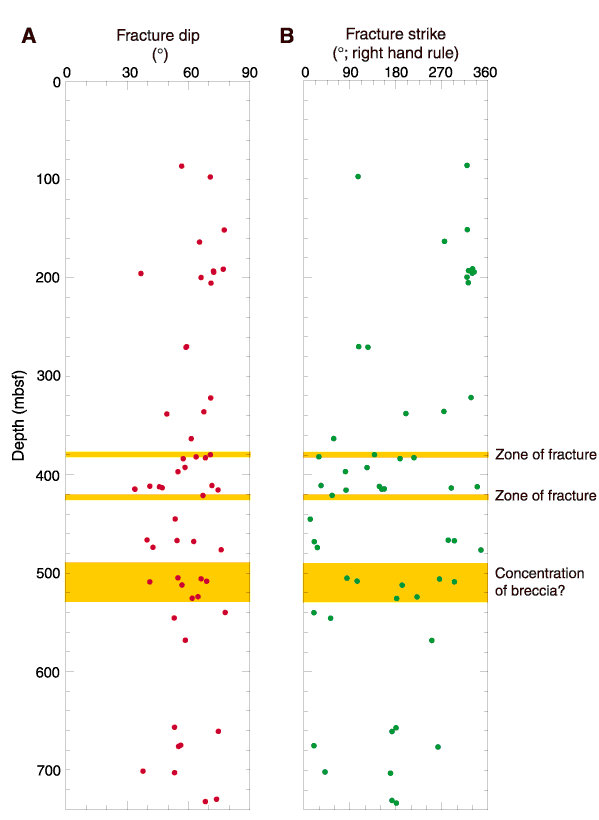
Figure F18.
Fracture (A) dip and (B) strike from
resistivity-at-the-bit image interpretation. Fracture strike is plotted so that
the dip direction is 90° counterclockwise from the strike. An increase in
fractures occurs between 380 and 520 mbsf. Orientations appear to be randomly
distributed. Note the two zones of fracturing (378-384 and 410-417 mbsf) and the
zone of high-resistivity bands (~500 mbsf) associated with intensive
deformation, possibly brecciation. The shallower zone of fracturing (378-384
mbsf) may correlate with a fractured zone recorded in the cores of Leg 190 Hole
1173A (382-384 mbsf) but the deeper zone has no such correlation. A steeply
dipping fracture would not be expected to correlate at the same depth between
two holes spaced 50 m apart, unless it represented part of a subhorizontal zone
of high-angle fractures.


![]()