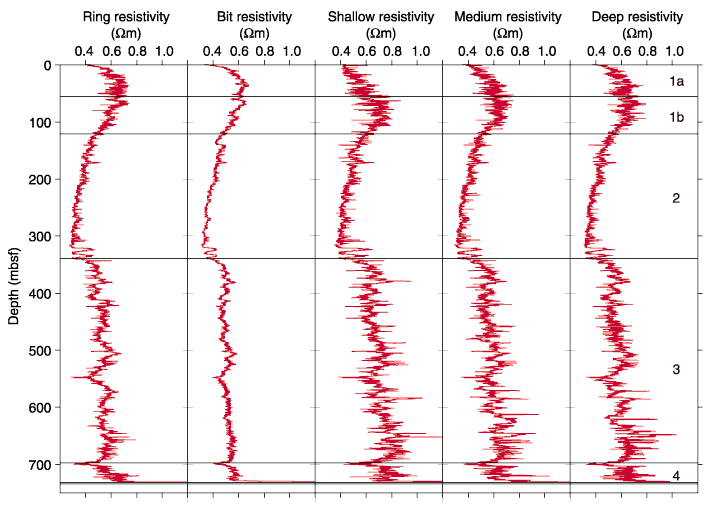
Figure F27.
Five resistivity logs acquired with the resistivity-at-the-bit tool. Lines
separate log Units 1-4. The horizontal scale was chosen to emphasize the
variations of resistivity in the upper 730 m but excludes the high resistivity
values of the basement, which are shown in Figure F28.


![]()