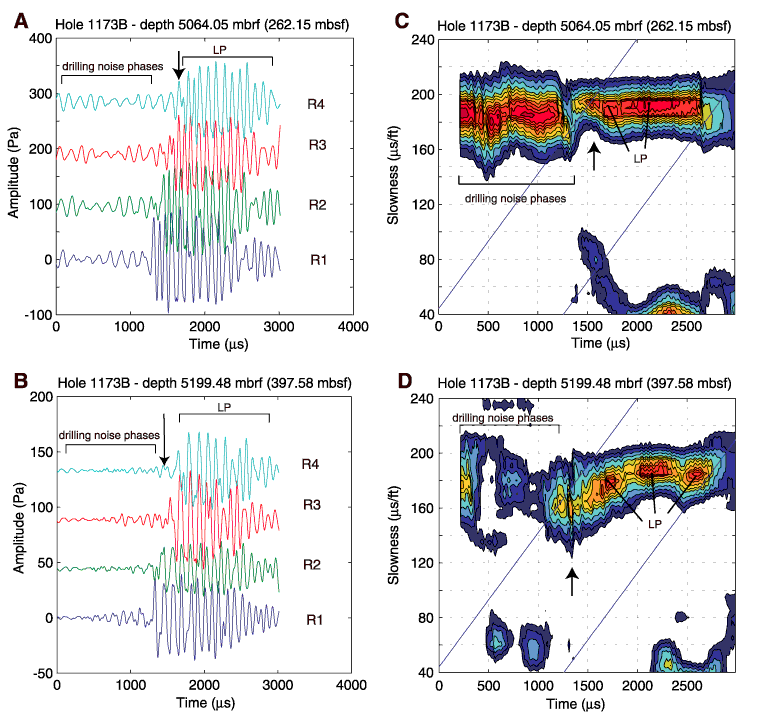
Figure F6.
Example waveforms from the IDEAL sonic-while-drilling tool, showing the main
arrivals at the four receivers (receiver distances above the source are 3.04 m
for R1, 3.25 m for R2, 3.45 m for R3, and 3.66 m for R4) at depths (A)
262.15 mbsf (5064.05 mbrf) and (B) 397.58 mbsf (5199.48 mbrf;
depths are measured to midway between R2 and R3) in Hole 1173B. Arrows indicate
the first arrival of a leaky P-wave (LP) mode. C, D.
Contour plots of coherence against slowness and arrival time for the wavetrains
in (A) and (B). The diagonal lines show the limits within which real arrivals
are expected; peaks outside these limits are likely to be noise or aliased
signal. Peaks due to the leaky P-wave mode are indicated by LP. Diagram
courtesy of V. Pistre, Schlumberger.


![]()