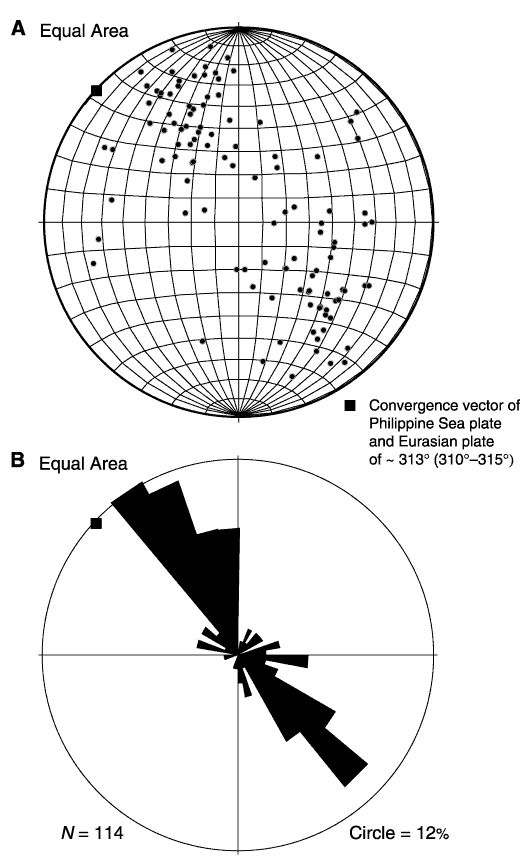
Figure F14. A.
Stereographic plot of poles to fracture planes (equal-area lower-hemisphere
projection). B. Rose diagram of azimuths of poles to fracture
planes, with bounding circle representing 12% of data points. Black square
represents the direction of plate convergence at the Nankai Trough (average of
313°; Seno et al., 1993). Fractures indicate a dominant northeast-southwest
trend (with poles at 90° to this trend) with a slight difference between the
average trend of poles and the convergence vector.


![]()