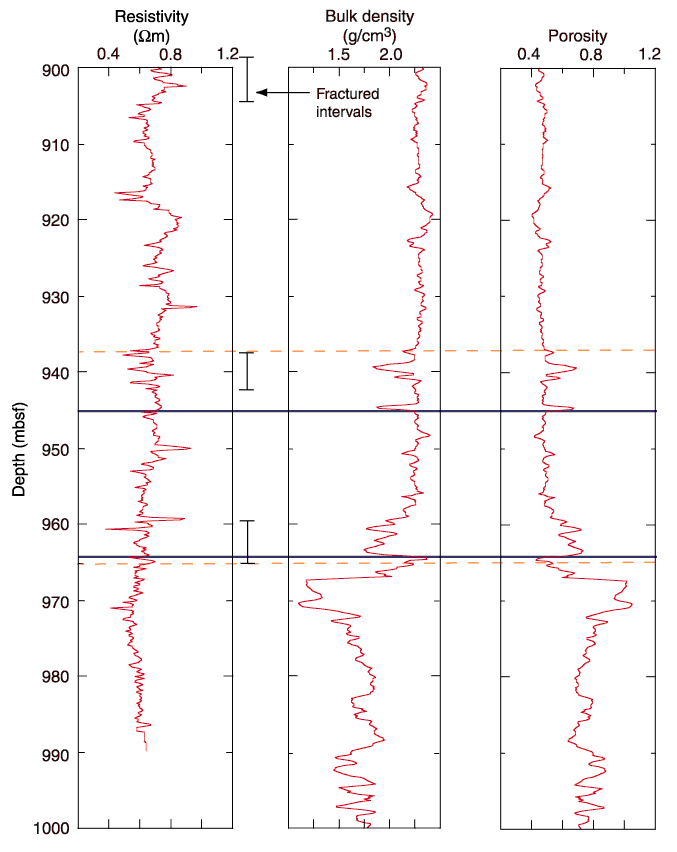
Figure F17.
Physical properties of the décollement zone and surrounding sections, Hole
808I. Logs of resistivity, bulk density, and density-derived porosity are shown
with depth. The décollement zone (from interpretation of deformation in
resistivity-at-the-bit images) is indicated by orange dashed lines. Discrete
fractured intervals within this zone occur at 897-904, 937-942, and 959-965 mbsf,
corresponding to overall lower resistivity (characterized by conductive
fractures) and lower density (as might be expected from open fractures). Blue
solid lines show the décollement zone as identified in Leg 131 Site 808 cores.


![]()