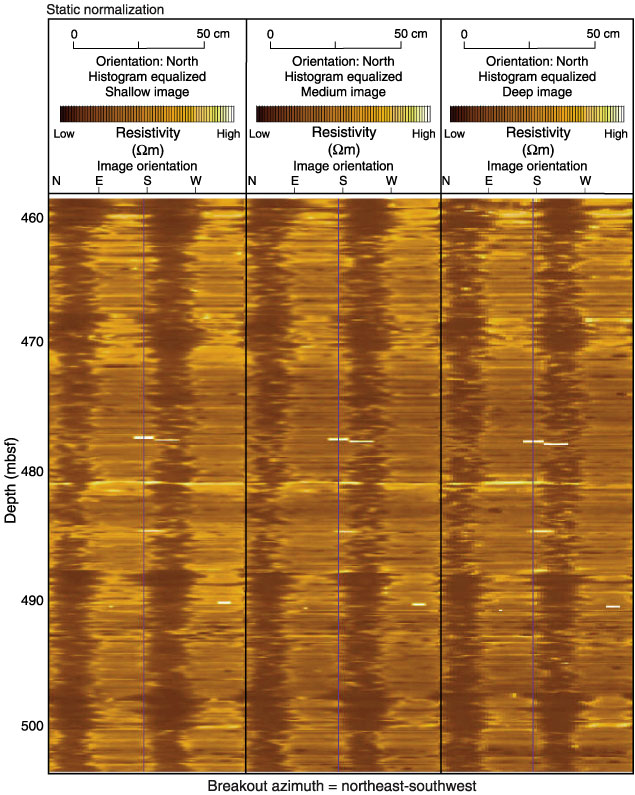
Figure F20.
Resistivity-at-the-bit images of borehole breakouts at 1-in (shallow), 3-in
(medium,) and 5-in (deep) penetration from the borehole, 460-505 mbsf. Breakouts
occur ~100 m below the frontal thrust zone close to the base of log Unit 2. See
Figure F19 for
details. Notice that the resistivity of breakouts shows little variation from
the shallow to deep image, suggesting a similar degree of deformation and
invasion at 1, 3, and 5 in from the borehole. This is in contrast to Figure F19,
where variability is seen between the three images. If possible variations in
drilling parameters are excluded, this difference may be related to lithologic
contrasts (note that sediments in the interval imaged by Figure F19
have higher resistivity than the sediments imaged here).