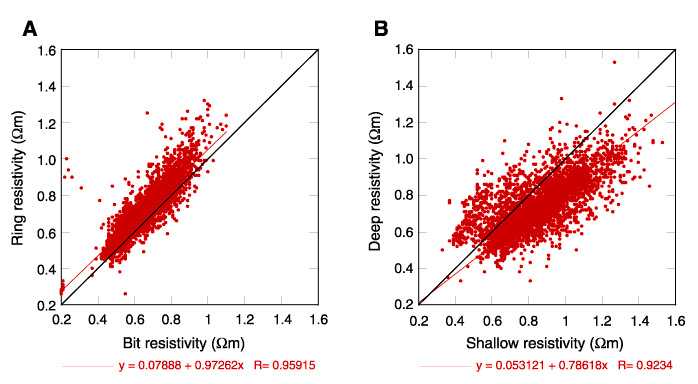
Figure F28.
Correlation diagrams of (A) bit vs. ring resistivity and (B)
shallow vs. deep resistivity. On each plot, the black line is the line of unit
slope passing through the origin and the red line is the linear fit to the data.
Equations describe the least-squares regression curves and R is the
correlation coefficient.


![]()