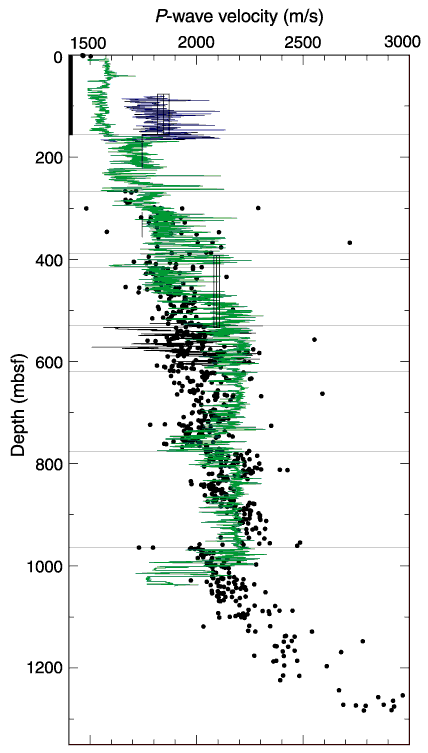
Figure F29.
Preliminary IDEAL sonic-while-drilling P-wave velocity picks compared
with core velocity data (solid circles), Leg 131 Hole 808B (blue curve) and Hole
808E (black curve) wireline logs, and Hole 808E vertical seismic profile values
(black bars; rectangles = formal error of line fit [Moore, 1993]). Heavy line
near depth axis shows extent of casing.


![]()