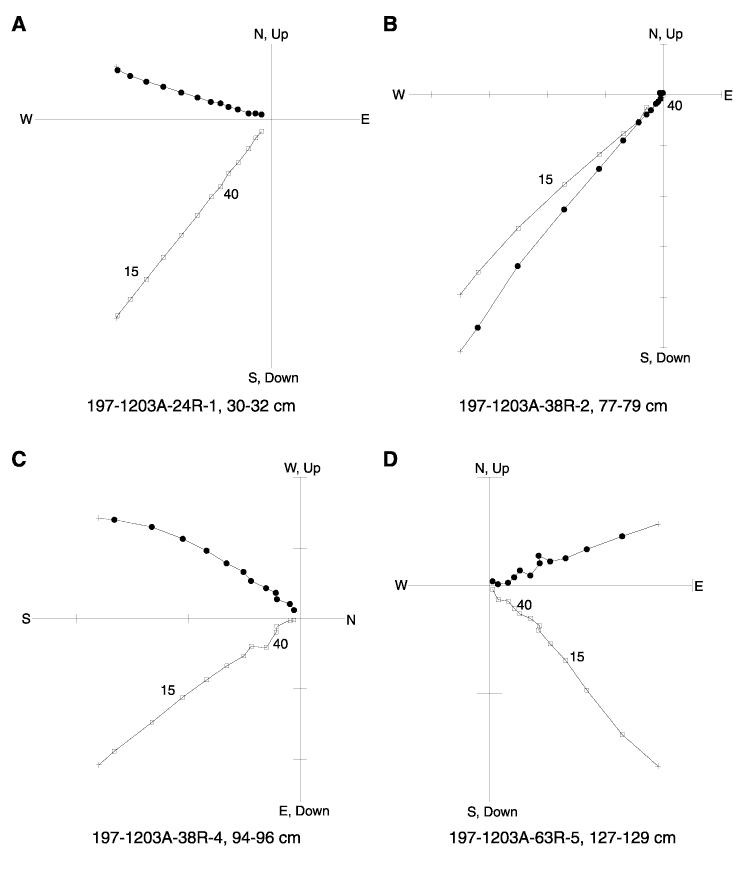
Figure F19.
Example orthogonal vector plot showing well-defined, stable magnetic behavior
recorded by Site 1203 volcaniclastic sediment samples. A.
Sample 197-1203A-24R-1, 30-32 cm. B. Sample 197-1203A-38R-2,
77-79 cm. C. Sample 197-1203A-38R-4, 94-96 cm. D.
Sample 197-1203A-63R-5, 127-129 cm. Open squares = vertical projection of
magnetization, solid circles = horizontal projection of magnetization.


![]()