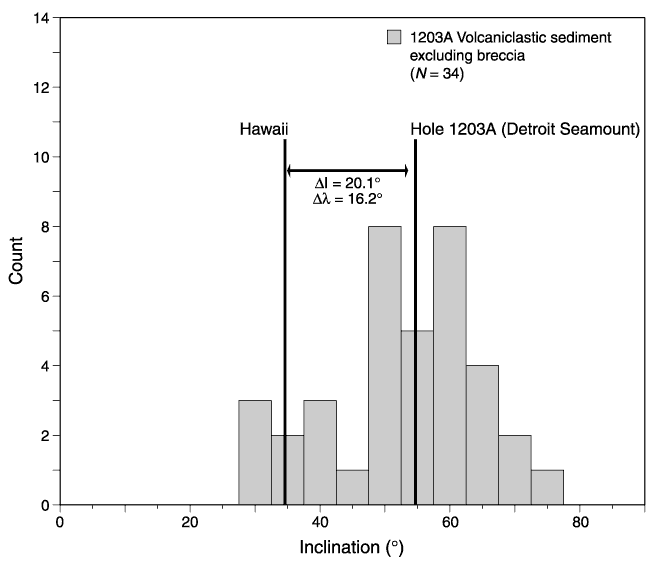
Figure F21.
Histogram of inclination values derived from principal component analyses on
alternating-field demagnetization data from Hole 1203A volcaniclastic sediment
samples.  l
= difference between the inclination of Hawaii and that of Detroit Seamount,
 = difference in the latitude of Hawaii and the formative paleolatitude of
Detroit Seamount.


![]()