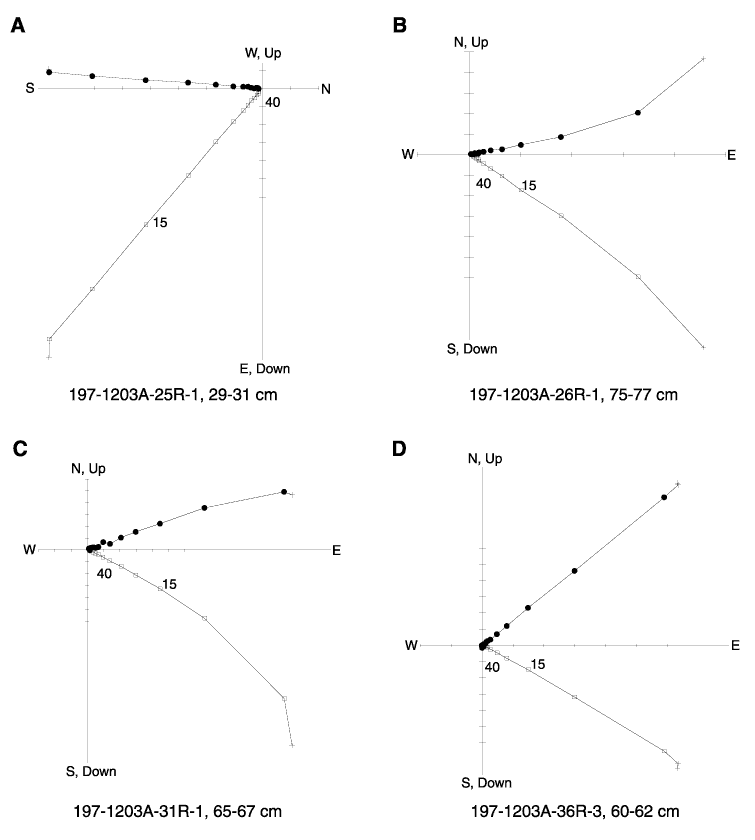
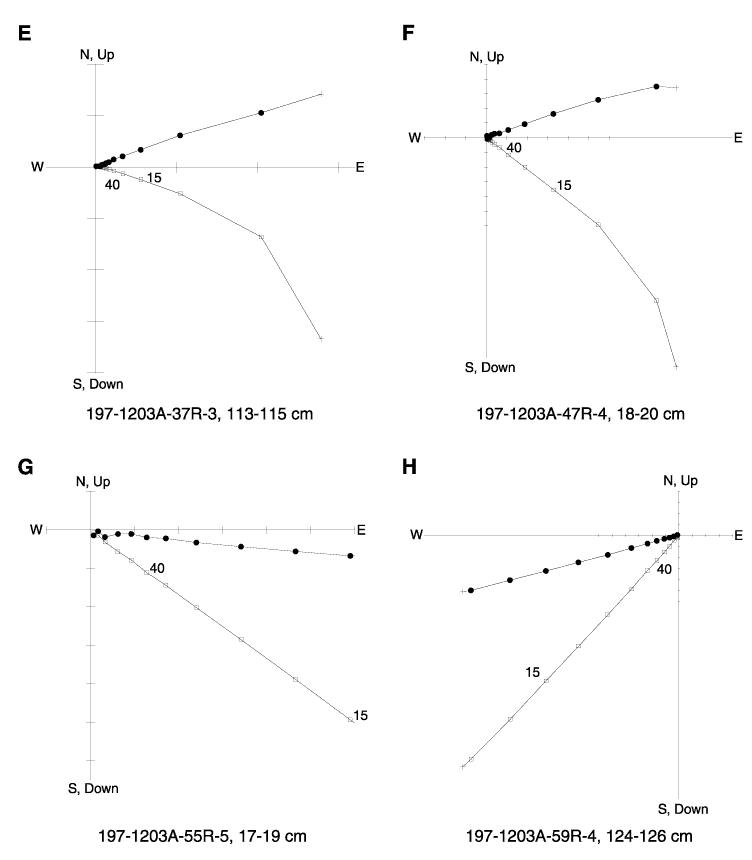
Figure F64. Example orthogonal vector plots showing well-defined, stable magnetic behavior recorded by basalt samples: Samples (A) 197-1203A-25R-1, 29-31 cm, (B) 26R-1, 75-77 cm, (C) 31R-1, 65-67 cm, (D) 36R-3, 60-62 cm, (E) 197-1203A-37R-3, 113-115 cm, (F) 47R-4, 18-20 cm, (G) 55R-5, 17-19 cm, and (H) 59R-4, 124-126 cm. Open squares = vertical projection of magnetization, solid circles = horizontal projection of magnetization.